Driving is the preferred method of transportation in the United States, and with 228,915,520 licensed drivers in the U.S. (Federal Highway Administration), there are quite a few people on the road. The longer we’re on the road, the more likely we are to witness a car crash or experience one ourselves.
Unfortunately, many car crashes are not minor, and that’s the risk we take every time we get into a car, whether we’re the driver or a passenger. But just what are the chances of dying in a car crash? Read on to learn about those odds as well as ways to mitigate the risk.
Key Stats
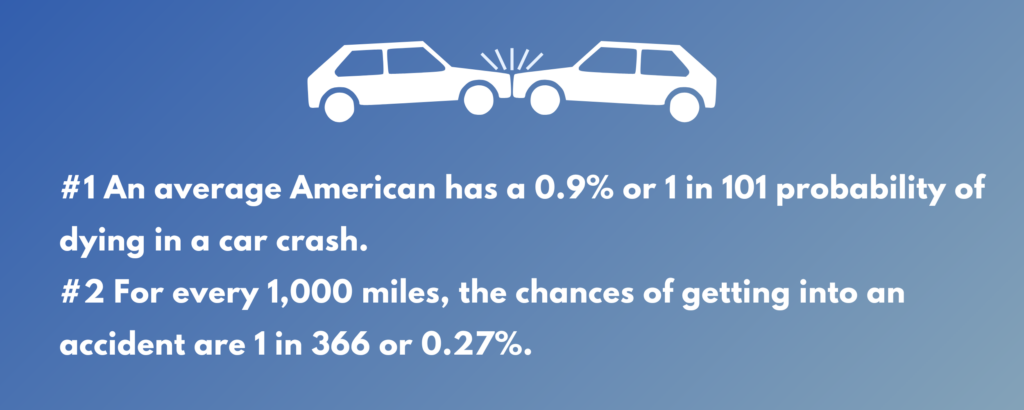
- Americans have a 1 in 101 chance of dying in a car crash, a 0.9% probability.
- For every 1,000 miles, the probability of getting into an accident is 1 in 366.
- The average American will get in 3 or 4 accidents throughout their lifetime.
- In the U.S., a fatal car crash occurs every 15 minutes.
- There are about 40,000 annual deaths in the U.S. as a result of motor vehicle traffic crashes.
- Worldwide, there are about 1.3 million annual deaths as a result of motor vehicle traffic crashes.
- The U.S. has more motor-vehicle deaths than in any other country.
- Motor-vehicle crashes are the leading cause of death for American teens.
- Speed has contributed to more than 25% of motor-vehicle fatalities over the past decade.
- 51% of motor-vehicle deaths occurred because seatbelts were not worn.
- Each year, we lose 10,000 lives—nearly 30 people a day—to drunk driving.
- When texting while driving, drivers are 23 times more likely to crash.
Odds of dying in a car crash
Although there were over 5.2 million reported accidents in 2020, only 1% of those were fatal (Forbes). In fact, the odds of dying in a motor vehicle accident in the U.S. are 1 in 101, meaning we have a 0.9% probability of dying in a car crash.
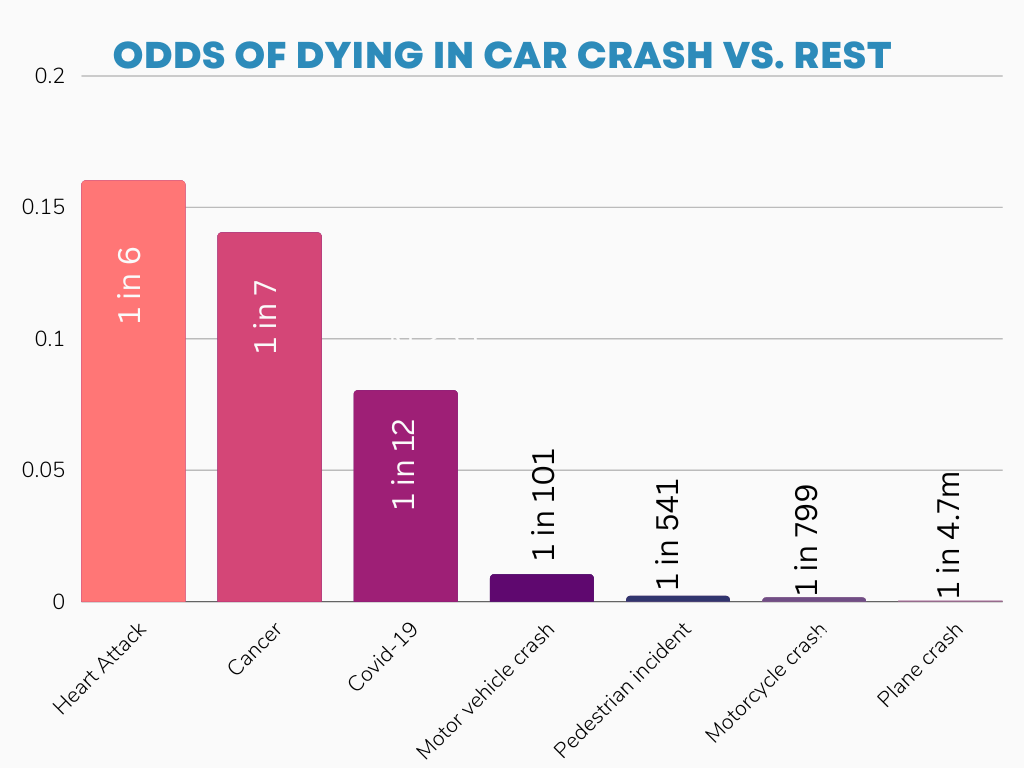
Below, see how this stacks up against other leading causes of death, as well as other transportation incidents, according to the National Safety Council (NSC):
- Heart disease: 1 in 6
- Cancer: 1 in 7
- Covid-19: 1 in 12
- All preventable causes of death: 1 in 21
- Chronic lower respiratory disease: 1 in 28
- Opioid overdose: 1 in 67
- Suicide: 1 in 93
- Motor vehicle crash: 1 in 101
- Pedestrian incident: 1 in 541
- Motorcycle crash: 1 in 799
- Bicycle incident: 1 in 3,396
- Plane crash: 1 in 4.7 million
The risk of dying in a car crash may be toward the top of the list, but, thankfully, most car accidents are not fatal. In looking at the odds of getting into any kind of car accident, Esurance estimates that for every 1,000 miles driven, the odds of getting into an accident are about 1 in 366. And, based on estimates from insurance claims, the average person will get in about 3 or 4 accidents throughout their lifetime (NHTSA).
Safest modes of transportation
While driving is the preferred method of transportation, it’s not the only method of transportation. Looking at the above statistics, the odds of dying in a car crash are much higher than the odds of dying in either a pedestrian incident (1 in 541), motorcycle crash (1 in 799), or bicycle incident (1 in 3,396).
But how about planes and trains?
- The odds of being in an airplane crash are about 1 in 1.2 million
- The odds of dying in a plane crash are about 1 in 4.7 million
- There were 893 railroad incident deaths in 2021 (Federal Railroad Administration)
As if the above numbers weren’t enough to calm the most nervous of fliers, a statistics professor at the Massachusetts Institute of Technology further put this into perspective by concluding that an individual could fly an average of once a day for 4 million years before dying in a plane crash (The Week). And, according to a Northwestern University professor, the risk of dying in a car crash is 30 times the risk of dying on urban rail and 66 times the risk of dying on a bus.
Does the type of car matter?
When it comes to the types of cars which may impact the odds of dying in a crash, Forbes found that passenger cars, particularly 4-door sedans (14,822 fatal crashes) and station wagons (2,149 fatal crashes), were involved in the most fatal crashes.
Below, see the total number of fatal crashes by type of vehicle in 2020:
- Passenger Cars: 20,868
- Light Trucks: 20,566
- Semi-Trucks and Other Large Trucks: 4,842
- Motorcycles: 5,715
- Buses: 156
- Other vehicles: 751
While passenger cars top the list, this could be due to the sheer number of this type of vehicle on the road. Regarding the light trucks involved in fatal accidents, 8,779 of those were light pickup trucks. In the large truck category, 71% of deaths in these crashes were occupants of other vehicles, and the majority of these crashes occurred on rural roads in the daylight (NSC). Alternatively, only 3% of registered vehicles are motorcycles; however, 14% of traffic fatalities involve motorcyclists, with the majority of fatal crashes happening in good weather (78%) and on urban roads (60%) (NSC).
Demographics
When looking at all of the motor-vehicle crashes for 2020, deaths vary by age group (NSC):
- 0-4 years old: 423
- 5-14 years old: 892
- 15-24 years old: 6,922
- 25-44: 14,345
- 45-64: 11,852
- 65-74: 4,089
- 75+: 3,816
The number of fatal crashes also varies by driver age, as seen below, including percentages (NSC):
- Younger than 16: 200, 0.3%
- 16-19: 3,500, 6%
- 20-24: 6,600, 11.2%
- 25-34: 13,100, 22.3%
- 35-44: 9,700, 16.5%
- 45-54: 8,400, 14.3%
- 55-64: 8,000, 13.6%
- 65-74: 4,500, 7.7%
- 75+: 4,800, 8.2%
According to the CDC, motor-vehicle crashes are the number one cause of death for teens across the country. This is likely due, in large part, to inexperience as well as heightened risk-taking behavior. Every day, an estimated eight teens are killed as a result of motor-vehicle crashes. About 11% of motor-vehicle fatalities involved drivers and passengers under 20 years of age (Forbes). Further, for drivers ages 16-19, the fatal crash rate is nearly three times higher than it is for drivers ages 20 and up, per mile driven (CDC).
Once drivers reach the age of 34, however, the amount of drivers involved in fatal crashes decreases as the driver’s age increases. (NSC).
Regarding fatal crashes with older drivers (65+), the older driver or their passengers accounted for the majority of deaths (NHTSA).
- Older driver deaths: 4,233 (59.5%)
- Passengers 65+ riding with an older driver: 533 (7.5%)
- Passengers 65 or younger riding with an older driver: 193 (2.7%)
- Other vehicle occupants: 1,424 (20.0%)
- Non-occupants: 725 (10.2%)
Regardless of age, more men are killed or injured than females, according to Forbes:
- 28,033 males died in car crashes in 2020
- 10,690 females died in car crashes in 2020
Time of day and week
On average, there are more fatal crashes over the weekend, with the most occurring on Saturdays. Non-fatal crashes were more common on weekdays, with the most occurring on Fridays (NSC). Fatal accidents occurred later at night during spring and summer when compared to the rest of the year.
- Fatal crashes peaked between 8 PM and 11:59 PM during the spring and summer
- Fatal crashes peaked between 4 PM and 7:59 PM from October through March
Odds of surviving different types of accidents
The odds of dying in a pedestrian incident are 1 in 541
Of course, there are some factors which impact these numbers. According to the NHTSA, most of 2020’s pedestrian traffic deaths occurred in:
- Urban settings (80%)
- On the open road (76%)
- With dark lighting conditions (76%)
When we look at these accidents as occurring on the open road, 24% of those occurred at intersections. According to the Bureau of Labor Statistics (BLS), about 56 pedestrian workers are killed each year by vehicles in work zones.
Rollover car crashes
While nothing is more severe than a fatal car crash, rollover car crashes are a different animal altogether. These kinds of accidents account for about 2% of all motor-vehicle accidents nationwide (NHTSA).
- SUVs are more likely to be involved in rollover crashes than any other type of vehicle
- SUV rollovers account for close to 37% of all fatal crashes
- Passenger vehicles account for about 15% of fatal crashes
- Close to 50% of all rollover accidents result in fatalities
However, prevention is key, as about 4 out of 5 people killed in rollover accidents were not wearing seatbelts.
Prevention: the key to increasing your chances of surviving a car crash
While the numbers we have explored thus far are frightening, following traffic laws, being mindful of dangerous weather conditions, and more can increase your chances of a safe journey. Below, we’ll explore the most common causes of car accidents so you can learn to lower your risk of death or serious injury while on the road.
1) Seatbelts and car seats
Wearing seatbelts is one of the many life-saving steps we can take whenever we’re in the car. The latest data shows that 51% of motor-vehicle deaths occurred because seatbelts were not worn (NHTSA). Further, the NHTSA estimates that the use of lap and shoulder seat belts results in the following:
- Passenger cars: front seat occupant deaths reduced by 45%
- Light trucks: front seat occupant deaths reduced by 60%
Regarding car seats in passenger cars, these are estimated to reduce the risk of infant (up to 12 months old) fatality by 71% and by 54% in toddlers (1-4 years old) (NHTSA).
2) Speed
We’ve all heard it before: speed kills. In fact, speed is one of the highest contributing factors in fatal highway crashes. Specifically, it has contributed to more than 25% of motor-vehicle fatalities over the past decade (Forbes).
According to Everquote, 42% of drivers admit that they don’t consider driving 10 mph over the speed limit to constitute speeding. However, driving 10 mph over the speed limit increases the risk of crashing by 9.1% (Fortune).
What’s more, pedestrians have a 90% chance of surviving a crash at 19 mph or less, but the rate of survival is only 50% at crashes of 20 mph or higher (AutoInsurance.org).
3) Impairment
Simply put, refraining from drinking and driving significantly lowers your odds of dying in a car crash. Each year, we lose 10,000 lives—nearly 30 people a day—to drunk driving (NSC).
Age is an important factor in alcohol-related fatal crashes. Alcohol was involved in 17% of fatal car crashes among drivers ages 16-17. Nearly 26% of 25- to 34-year-old drivers involved in fatal crashes were impaired by alcohol, compared to less than 20% of 45- to 54-year-old drivers and less than 10% for drivers ages 75 and older.
According to the CDC, men are more likely to drive under the influence; regarding fatal crashes, 22% of male drivers were alcohol-impaired, compared to 16% of female drivers.
4) Distracted driving
Staying alert can help prevent driving fatalities. Out of all distracted driver crashes, 14% involved cell phone use (NSC). While it may seem harmless enough, dialing a phone leaves drivers 12 times as likely to crash, while texting and driving leaves you 23 times as likely to crash (Virginia Tech Transportation Institute). Texting and driving is particularly dangerous among teens, leading to 11 teen deaths per day.
Wrapping Up
Ultimately, driving is inherently dangerous; however, only about 1% of accidents are fatal. That doesn’t mean we shouldn’t exercise caution whenever we’re on the road, however. While we cannot control other drivers on the road, there are steps we can take to minimize our own risk of becoming one of these statistics. We hope you take the above information and use it to feel more empowered to drive safely in order to protect yourselves and others on the road.
