From the great American road trip to auto shows and NASCAR, it’s clear that Americans love cars. Cars represent freedom, status, and comfort. While automobiles were first introduced to consumers far earlier, it wasn’t until the 1950s that American car culture came into its own. After the Second World War, American manufacturers were able to shift their focus over to consumer goods, rather than the war-related goods which previously had a hold on the industry. As suburban development boomed, so did the need for cars, and thousands of jobs were created in automotive factories to keep up with demand. Through the years, we have remained equally car-centric and have even developed more ways to stay inside the car, from drive-ins to drive-throughs.
Today, the average American spends about 5% of each year behind the wheel; therefore, it should come as no surprise that most American households have access to cars. Read on to learn just how many.
How Many People Own Cars in the US?
Key stats regarding American car ownership [2025]:
- There are 212 million car owners in America – in percentage terms, 67% of Americans own at least one car
- As of 2024, there are 297 million registered vehicles in America – 293.90 million private and commercial vehicles and about 4.1 million publicly owned vehicles.
- America ranks second, next to China, in total vehicles and sixth in vehicles per capita worldwide (per 1000 people).
- 91.7% of American households own at least one car
- 32.5% of American households have one car
- 37.1% of American households have two cars
- 22.1% of American households have 3 or more cars
- 8.3% of Americans have no access to cars
- The average American drove 14,784 miles in 2025 alone
- In 2023, An estimated 14.5 million new cars were sold in U.S. out of which 1.7 million or 11.7% were fully electric vehicles
- 36% of the registered vehicles in America are cars.
- In 2024, the average of age of car in U.S. was 12.50 years
To put things into perspective:
- 91.2 million new cars were sold worldwide in 2024
- There are more than 1.4 billion cars worldwide; about 19% of those are in the U.S.
- This equates to 0.89 cars per capita or 890 vehicles per thousand people in the U.S.
- At about 0.9 cars for every person, the U.S. is just slightly ahead of New Zealand for the highest per capita vehicle ownership in the world
- 7.8 million fully electric vehicles were sold worldwide in 2022, accounting for about 10% of all vehicles sold
From the above stats alone, it’s clear that we’re heavily reliant on our cars, but not all regions are created equal
Vehicle ownership by region
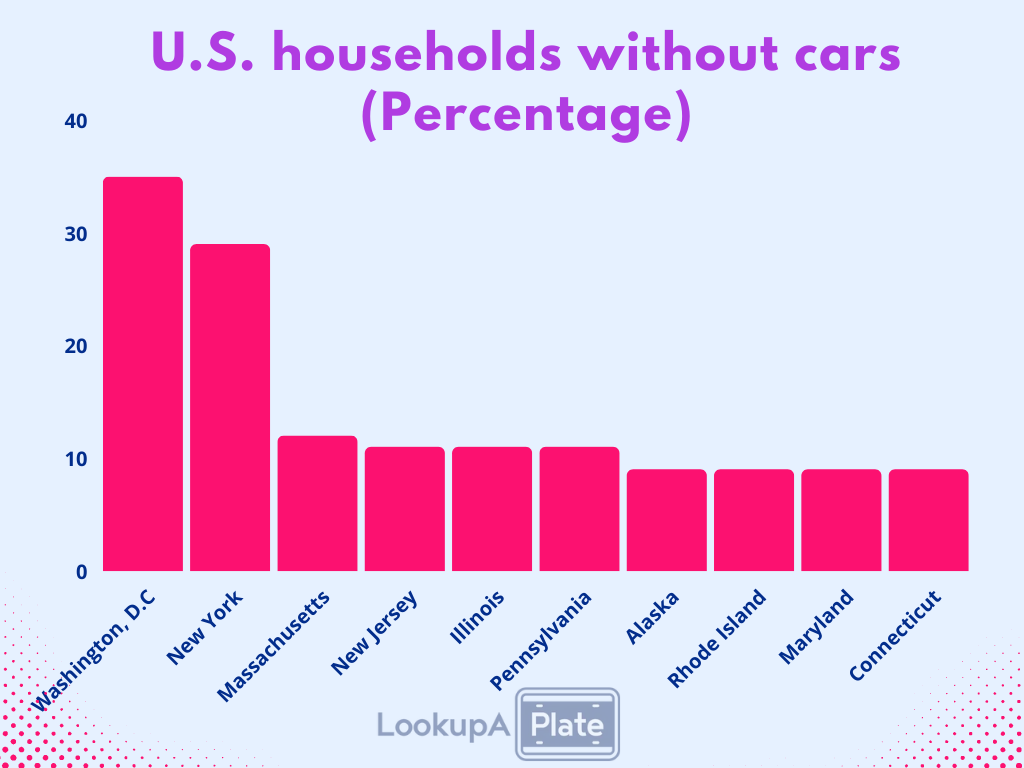
For the most part, the lowest car ownership rates per household can be found in the Northeast. This is largely due to the proliferation of public transportation and a high concentration of major cities, which are more pedestrian-friendly than their rural counterparts. Specifically, New York, Massachusetts, and New Jersey have the lowest car ownership rates.
Below, see the states with the lowest percentages of homes without cars in the U.S., according to the U.S. Census Bureau.
- 35%: Washington, D.C.
- 29%: New York
- 12%: Massachusetts
- 11%: New Jersey
- 11%: Illinois
- 11%: Pennsylvania
- 9%: Alaska
- 9%: Rhode Island
- 9%: Maryland
- 9%: Connecticut
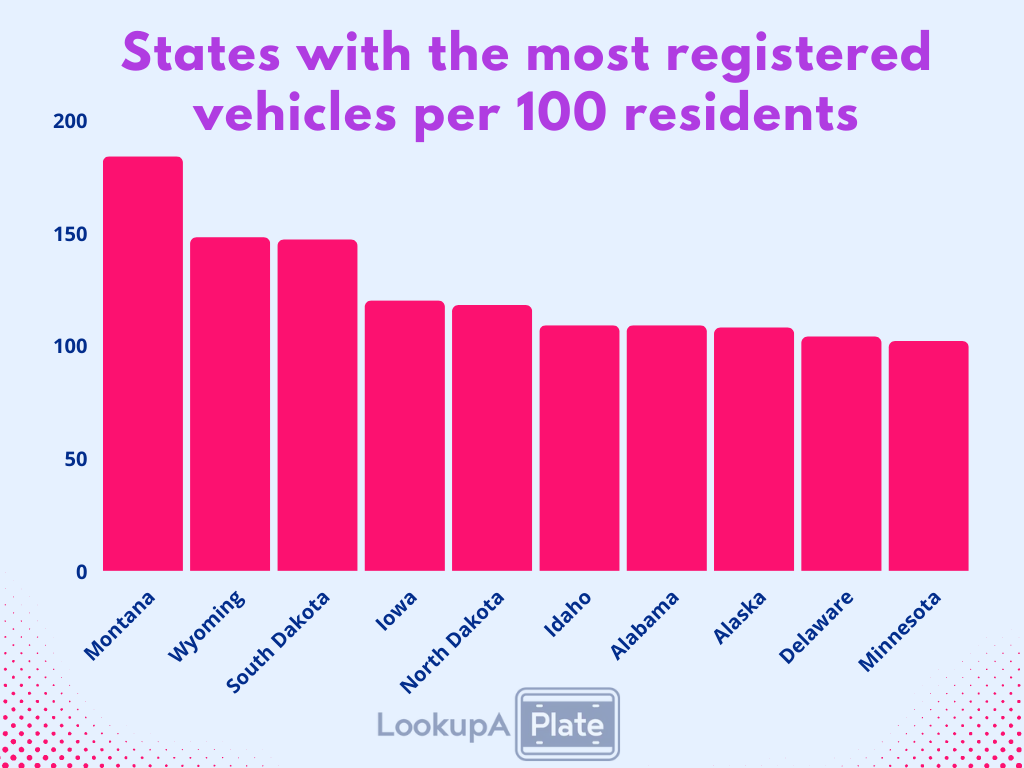
In looking at the number of registered vehicles per capita, states in the Great Plains have the highest numbers, according to the U.S. Census Bureau. This makes perfect sense, as everything is much more spread out in these states, where it would be difficult to get around without a car.
Below are the top 10 states with the most registered vehicles per 100 residents.
- 184: Montana
- 148: Wyoming
- 147: South Dakota
- 120: Iowa
- 118: North Dakota
- 109: Idaho
- 109: Alabama
- 108: Alaska
- 104: Delaware
- 102: Minnesota
Comparatively speaking, Washington, D.C. and New York have just 51 and 58 registered vehicles per 100 residents, respectively, and you can imagine why that is. For instance, New York’s (and America’s) largest city, New York City, is notorious for its carless residents. Between taxis, public transportation, and walkability, getting from point A to point B simply doesn’t require a car for many New Yorkers. What’s more, street parking and the high cost of car insurance in the city also disincentivizes New Yorkers from owning a car. So, unsurprisingly, neither New York City nor Washington, D.C. is on the below list of the top 10 cities with the highest rates of vehicle ownership.
Instead, see those cities with the highest percentages of households that own at least one car (U.S. Census Bureau, taken from the 50 largest metropolitan statistical areas in the U.S.):
- 96.1%: Raleigh, NC
- 95.8%: Nashville, TN
- 95.7%: Riverside, CA
- 95.6%: Austin, TX
- 95.4%: Dallas, TX
- 95.2%: Orlando, FL
- 95.1%: Charlotte, NC
- 95.1%: Oklahoma City, OK
- 94.8%: Houston, TX
- 94.7%: Salt Lake City, UT
Similar to New York, some of the other large Northeastern cities, namely Boston and Philadelphia, have low rates of car ownership for similar reasons.
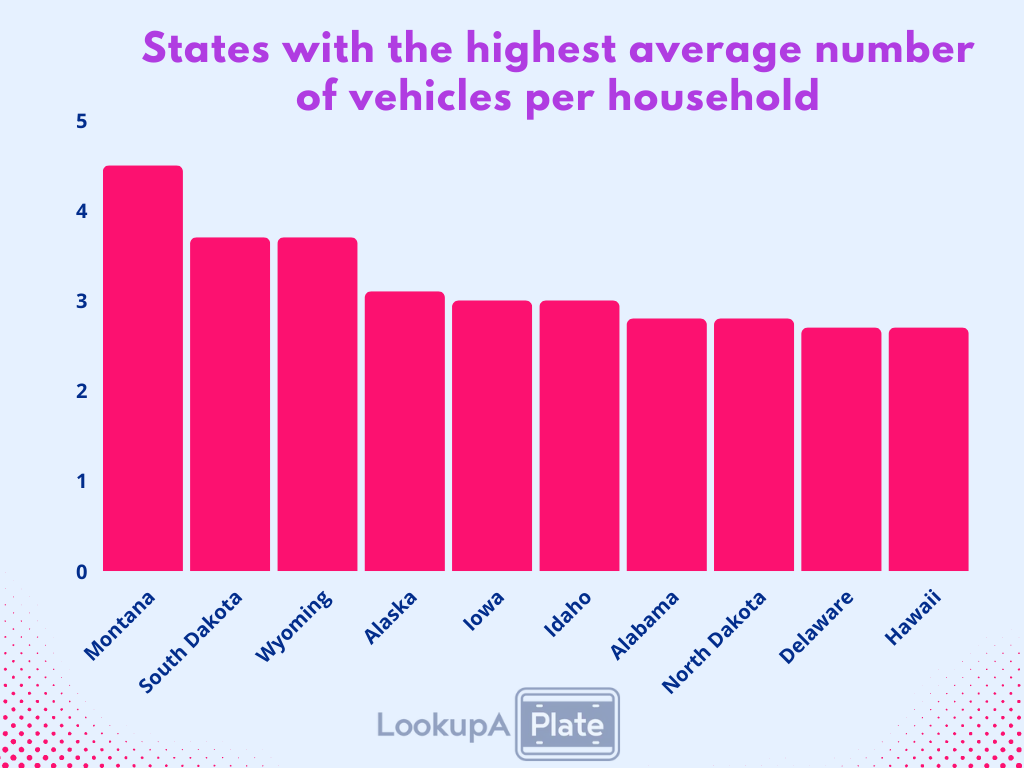
When it comes to the average number of vehicles per household, however, the below states and cities take the cake.
States with the highest average number of vehicles per household:
- 4.5: Montana
- 3.7: South Dakota
- 3.7: Wyoming
- 3.1: Alaska
- 3.0: Iowa
- 3.0: Idaho
- 2.8 Alabama
- 2.8: North Dakota
- 2.7: Delaware
- 2.7: Hawaii
Cities with the highest average number of vehicles per household:
- 2.14: Riverside, CA
- 2.04: Salt Lake City, UT
- 2.04: San Jose, CA
- 1.98: Nashville, TN
- 1.97: Richmond, VA
- 1.96: Raleigh, NC
- 1.96: San Diego, CA
- 1.95: Sacramento, CA
- 1.94: Denver, CO
- 1.92: Charlotte, NC
While in Montana, there’s an average of 4.5 vehicles per household, this is in stark contrast to Washington, D.C. (1.2) and New York (1.5). As for cities, only a handful average out to have more than 2 cars per household, with the rest hovering just below 2.
Best-selling cars by region
Now that we have a bit more background on how many Americans own cars in different regions, let’s explore the specific kinds of cars that Americans are most fond of. The most popular type of car across the board? You guessed it: the pickup truck.
These are 2022’s 10 best-selling cars in the U.S. by units sales (according to Motor Intelligence):
- Ford F-Series: 653,957
- Chevrolet Silverado: 513,354
- Ram pickup: 468,344
- Toyota RAV4: 399,941
- Toyota Camry: 295,201
- Tesla Model Y: 252,000
- GMC Sierra: 241,522
- Honda CR-V: 238,155
- Toyota Tacoma: 237,323
- Jeep Grand Cherokee: 223,345
According to The Balance, 48% of vehicles sold in the US are imported, largely from Japan, Germany, Mexico, Canada, and China, which isn’t too far off from the above list, where only six (Ford, Chevrolet, Ram, Tesla, GMC, Jeep) out of the top ten best-selling cars are American-made. Interestingly enough, Toyota was recently named the best-selling car manufacturer in the world (CNBC). With three of its models in the top 10 above, Toyota was the top-selling import in the U.S. as well.
And how do these vehicles sell across the country, according to Edmunds? In the Northeast, the Toyota RAV4 and Honda CR-V are top sellers. However, the pickup tops the list in the rest of the country, with the Ford F-Series and the Chevrolet Silverado being the preferred car in the Midwest. The Chevrolet Equinox is also one of the top SUVs sold in multiple Midwestern states. In the South, it’s all about the Ford F-Series and the Chevy Silverado; however, the Toyota Camry and Toyota RAV4 are two of Florida’s top picks. And, last but not least, we have the West. There, the top sellers are the Ford F-Series, the Chevy Silverado, and the Ram pickup.
However, the Toyota RAV4 is also a contender. In California specifically, the Honda Civic is the number one seller, and the Tesla Model Y and Model 3 are also in the state’s top 5 best-selling cars.
Cars still account for the second-largest purchase among American households, second only to home purchases, and while we’ve continued to make this purchase, there were less cars sold last year than in recent years. Specifically, there were an estimated 13.7 million units sold in 2022, a lower figure than each of the previous two years (15.1 million units in 2021 and 14.6 million units in 2020) and much lower than a typical, pre-pandemic year. In fact, last year’s sales were the lowest they’ve been since 2011, when about 12.78 million units were sold–and when we were bouncing back from a recession. In looking at the last two decades, numbers hovered between 16.1 million and 16.9 million units sold each year from 2002-2007 before dramatically dropping to 10.4 million units sold in 2008. Numbers steadily increased from 2009 onwards until they remained around 17 million units sold from 2015 until the pandemic hit.
Since the start of the pandemic, specific parts like computer chips have been difficult for auto makers to obtain, creating supply issues that drove vehicle prices higher. This allowed manufacturers to earn a profit despite lower overall sales. However, with supply already improving and demand likely to decrease due to the weakened global economy, these high prices are likely to fall. At present, leading experts estimate 14.8 million units will be sold in 2023.
But what about EV sales, specifically?
Electric cars and the future of car ownership
In 2022, nearly 6% of all new car sales in the U.S. were fully electric vehicles (EVs), with over 800,000 units sold, according to Motor Intelligence. While that may not sound like a lot, it is a 2.6% increase in sales compared to 2021. What’s more, it was a little more than a decade ago that EV sales were close to zero, so it’s progress. And, according to Bloomberg, there is a very real possibility that electric cars could outsell gasoline- and diesel-powered cars by 2040.
Below, see the top-selling EVs of 2022 in the U.S. according to data from Kelley Blue Book:
- Tesla Model Y
- Tesla Model 3
- Ford Mustang
- Tesla Model S
- Chevrolet Bolt EV/EUV
While Tesla models dominated the market, making up 65% of the total EV sales in the U.S., other manufacturers like Ford, Hyundai, Kia, and GM are nipping at its heels. On a global scale, Tesla was also the top EV seller, followed by China’s BYD Co., SAIC Motor Corp, and VW Group brands (Center of Automotive Management).
Time will tell how long Tesla will remain the front-runner, but one thing’s for sure: EV cars are only gaining in popularity. Many manufacturers have already committed to ending production of fuel-powered cars within the near future. The European Union’s zero-emission mandate will ban all new non-electric cars by 2035, and a similar proposition was discussed on a global scale at recent Climate talks. Oslo, London, and other cities have discussed banning gas- and
diesel-fueled cars in their city centers. Back home, states such as California, Massachusetts, and New York plan to end sales of gas-fueled cars in just over a decade. Meanwhile, President
Biden’s goal is to see 50% of new car sales being either electric, hybrid, or fuel cell by 2030; if achieved, EVs could make up more than 60% of all cars on the road by 2050. All of this legislation will only continue to drive manufacturers to invest in EV production.
Still, while gas prices continue to soar, many consumers are still wary of EVs due to their perceived higher prices, limited battery range, and lack of charging stations at present. Further, analysts remind us that this increase in EV purchases may not continue as steadily over the coming years due to a number of factors such as the state of the global economy and Europe’s rising electricity prices.
In any case, whether car ownership switches over to EVs or even self-driving (autonomous) cars in the coming years, it’s safe to say our obsession with cars isn’t ending anytime soon.
Sources & Reference
- https://www.cnbc.com/2022/12/27/why-2023-could-be-another-difficult-year-for-the-auto-industry.html
- https://www.wsj.com/articles/evs-made-up-10-of-all-new-cars-sold-last-year-11673818385
- https://www.fhwa.dot.gov/policyinformation/statistics/2020/mv1.cfm
- https://data.census.gov/cedsci/table?tid=ACSDP5Y2019.DP04&hidePreview=true
