Speeding is one of the most common traffic violations in the U.S., and it can have serious consequences for drivers and others on the road. Whether rushing to work, trying to make up time on a long trip, or not paying attention to the speedometer, exceeding the speed limit can happen easily. But how common is it to receive a speeding ticket? How much do they cost, and who typically gets them?
In this article, we will answer these questions and look at the essential facts related to speeding, including fatality rates, the effect of the Covid-19 pandemic on driver habits, driver demographics, and trends.
SPEEDING TICKET KEY STATISTICS
- In 1896, the first recorded speeding ticket in the world was issued to a man named Walter Arnold in England. He drove his “horseless carriage” through the village of Paddock Wood, Kent at eight mph in a two mph zone.
- In 1904, the first speeding ticket in the U.S. was issued to Harry Myers in Dayton, Ohio. Authorities recorded his automobile traveling down West Third Street at a reckless 12mph.
- Nearly 41 million U.S. drivers receive speeding tickets every year. This annual total equates to 112,000 speeding tickets issued per day.
- The average cost of a speeding ticket in the U.S. is $150.
- Over $6.2 billion is paid annually in speeding ticket fines in the U.S.
- On average, drivers who receive a speeding ticket pay 24% more, or nearly $380 more, for car insurance annually.
- Research by Insurify identified Ohio as the state with the highest number of speeding tickets issued in 2022. The below table shows the top ten worst offending states:
State | % of drivers with a speeding ticket on record |
Ohio | 14.95% |
Iowa | 14.87% |
North Dakota | 14.41% |
Wisconsin | 13.43% |
South Carolina | 13.35% |
Virginia | 12.65% |
Alaska | 12.40% |
Washington | 12.17% |
Colorado | 12.03% |
Wyoming | 12.01% |
- The average speed limit for passenger vehicles in the U.S. is 66mph.
- The fastest speed cited on a ticket in the U.S. is 242mph. Reportedly, a man named Arthur Chirkinian drove his Koenigsegg CCR at 242mph in a 75mph zone during a Texas rally in 2003.
- With 7,653 speed cameras, the U.S. has the fourth-highest number of speed cameras worldwide. The below table shows the top ten countries:
Country | Total number of speed cameras |
Russian Federation | 18,401 |
Brazil | 16,865 |
Italy | 11,025 |
United States | 7,653 |
United Kingdom | 7,494 |
Germany | 4,686 |
France | 3,647 |
Belgium | 3,018 |
United Arab Emirates | 2,885 |
Sweden | 2,423 |
SPEEDING ACCIDENTS AND FATALITIES
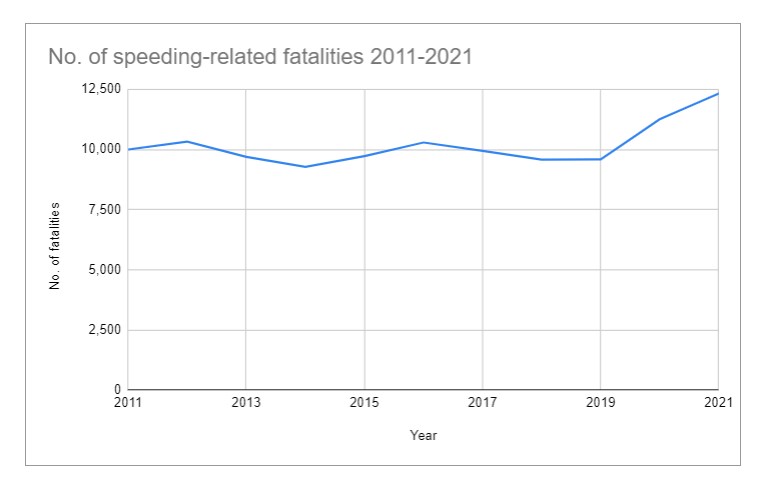
- The latest data from the National Highway Traffic Safety Administration (NHTSA) shows that in 2021, speeding caused 12,330 deaths, accounting for 28.7% of all traffic fatalities.
- The number of people killed in speeding-related crashes increased by 7.9% in 2021 versus 2020. 2021 was the third consecutive year that saw an increase in deaths caused by speeding:
- Driving too fast for the conditions or over the speed limit was the most significant contributing factor in fatal crashes in 2020, attributed to 19.1% of the drivers involved.
- The NHTSA estimated the economic cost of speed-related deaths in 2019 was $46 billion. They calculated the societal cost of speed-related deaths was $225 billion.
- Local roads saw the most speeding in 2020, with 87% of all speeding-related traffic fatalities occurring on non-interstate roads.
SPEEDING DURING THE COVID-19 PANDEMIC
- At the beginning of the coronavirus pandemic, New York’s automated speed cameras issued twice as many tickets daily compared with pre-pandemic levels. On average, 24,800 speeding tickets were issued daily in April 2020, up from 10,800 tickets in early February 2020.
- In 2020, speeding fatalities increased significantly (+17% versus 2019) despite reduced traffic volumes and car accidents due to Covid-19 lockdowns.
- Average recorded speeds across the U.S. surged in some areas during the first three months of the pandemic. Notable examples include:
- The typical 5 p.m. speed on Interstate 405 in Los Angeles more than trebled, from 19mph to 68mph.
- In Brooklyn, New York the average speed from 4 p.m. to 7 p.m. increased 85% to 46mph.
- The average speed on Interstate 290 in Chicago increased 158%, from 62mph to 24mph.
- Suggested theories for the increase in speeding offenses during the pandemic are:
- Empty roads encouraged drivers to exceed the speed limit.
- Drivers breaking the speed limit prompted other drivers to drive too fast.
- Drivers believed that police forces were not prioritizing traffic stops.
- The boredom and stress of the lockdown spurred drivers to seek excitement by driving dangerously.
SPEEDING DRIVER DEMOGRAPHICS AND BEHAVIOURS
- The most ticketed age group is 30- to 49-year-olds, specifically those with a household income of at least $75,000. People in this demographic tend to be under-pressure, busy professionals or parents who may (unintentionally or not) resort to speeding and not fear the financial repercussions of tickets.
- Analysis of the Minnesota State Patrol’s ticket database revealed that men of every age group get at least 50% more speeding tickets than women.
- Young male drivers are the most likely to be speeding at the time of fatal crashes. In 2020, 35% of male drivers in the 15- to 20-year-old age group involved in fatal accidents were speeding at the time of the crashes, compared to just 18% of female drivers in the same age group.
- According to a 2020 survey by the American Automobile Association, 45.1% of Americans had driven 15mph over the speed limit on a freeway at least once in the 30 days prior.
- 18.6% of drivers involved in fatal crashes in 2020 had previous convictions for speeding.
- Speeding coincides with two other risk-taking behaviors: not wearing a seatbelt and drink-driving. Of the drivers involved in fatal speed-related crashes in 2021, 38.9% were alcohol-impaired, and 44.9% were not wearing a seatbelt. 20.4% of drivers engaged in all three behaviors.
- Many drivers do not reduce their speed in poor driving conditions. For example, in 2021, speeding was the main factor in fatal accidents for:
- 33% on roads with ice or frost
- 38% on roads with moving or standing water
- 43% on roads with mud, dirt, or gravel
SPEEDING TRENDS
- The habit of reckless driving, formed during the low-traffic periods of pandemic shutdowns, did not end as the lockdowns eased and traffic increased, as speeding-related deaths in 2021 were the highest recorded number since 2007 (12,330 deaths in 2020 versus 13,040 in 2007).
- Research from the NHTSA showed that from January 2021 to June 2021, speeding and traveling without a seatbelt happened more frequently than before the coronavirus pandemic.
- The preliminary estimate for total traffic fatalities in 2022 is 46,270, down 2% from 46,980 in 2021, but up 9% from 42,339 in 2020. Assuming speeding fatalities comprise 29% of the total, the estimated number of deaths caused by speeding in 2022 is 13,418.
- In January 2022, the US Department of Transportation announced the National Roadway Safety Strategy, which aims to eradicate all traffic fatalities. A key element of the plan is to implement safer, lower speed limits nationally.
CONCLUSION
Despite being a surprisingly common occurrence, speeding tickets alone have proven to be an insufficient deterrent in reducing the alarming number of deaths resulting from speed-related accidents. The persistent increase in these fatalities over the past three years emphasizes the urgent need for a more comprehensive approach to tackle this issue head-on.
The Roadway Safety Strategy is an ambitious initiative that takes a holistic approach to improve road safety, from lower speed limits, and increased enforcement through speed cameras, to traffic-calming measures, and comprehensive awareness programs. Ultimately, it is down to each driver to be mindful of the potentially tragic consequences of speeding and take their foot off the gas.
Sources:
- https://www.guinnessworldrecords.com/world-records/414379-first-person-charged-with-a-speeding-offence
- https://ohiohistorycentral.org/w/World’s_First_Speeding_Ticket?rec=2599
- https://crashstats.nhtsa.dot.gov/Api/Public/ViewPublication/813435
- https://crashstats.nhtsa.dot.gov/Api/Public/ViewPublication/813375
- https://www.scdb.info/en/stats/
- https://driver-start.com/blog/the_most_common_traffic_tickets/
- https://www.forbes.com/advisor/car-insurance/speeding-ticket-rate-increase/
- https://www.washingtonpost.com/local/trafficandcommuting/the-coronavirus-pandemic-emptied-americas-highways-now-speeders-have-taken-over/2020/05/10/c98d570c-8bb4-11ea-9dfd-990f9dcc71fc_story.html
- https://www.nytimes.com/2020/04/16/nyregion/coronavirus-nyc-speeding.html
- https://www.nhtsa.gov/sites/nhtsa.gov/files/2021-10/Traffic-Safety-During-COVID-19_Jan-June2021-102621-v3-tag.pdf
- https://injuryfacts.nsc.org/motor-vehicle/overview/preliminary-estimates/
- https://www.nsc.org/newsroom/nsc-statement-on-usdot-national-roadway-safety-str
- https://crashstats.nhtsa.dot.gov/Api/Public/ViewPublication/813403.pdf
- https://newsroom.aaa.com/2021/10/aaa-finds-better-behavior-behind-the-wheel-but-theres-room-for-improvement/
- https://www.nhtsa.gov/press-releases/nhtsa-launches-new-campaign-remind-drivers-speeding-wrecks-lives
- https://www.iihs.org/topics/speed/speed-limit-laws
- https://blog.appwinit.com/fastest-speeding-tickets/
- https://crashstats.nhtsa.dot.gov/Api/Public/ViewPublication/813320
- https://injuryfacts.nsc.org/motor-vehicle/motor-vehicle-safety-issues/speeding/
- https://www.aceable.com/blog/the-likelihood-of-getting-a-traffic-ticket-by-age-and-gender
