Car accidents are an unfortunate reality of modern life. They can affect us all, whether we are drivers or not. But just how often do these crashes occur? In this article, we will take an in-depth look at the frequency of car accidents in the U.S., breaking it down by the second, minute, hour, day, month, and year. By examining the latest data and statistics, we will gain a better understanding of the scale of the problem and the impact it has on American society.
So fasten your seatbelt as we review the numbers behind one of the most pressing issues on America’s roads.
HOW OFTEN DO CAR ACCIDENTS HAPPEN?
According to the National Highway Traffic Safety Administration’s 2020 crash data report, there were 35,766 crashes resulting in fatalities, 1,593,390 crashes resulting in injury, and 3,621,681 crashes resulting in property damage in United States. To put in perspective, that’s about 5.2 million car accidents over the course of a year.
Taking into account all of these incidents, this equates to:
- 0.17 car accidents per second (or 1 accident every 6 seconds)
- 10 car accidents per minute
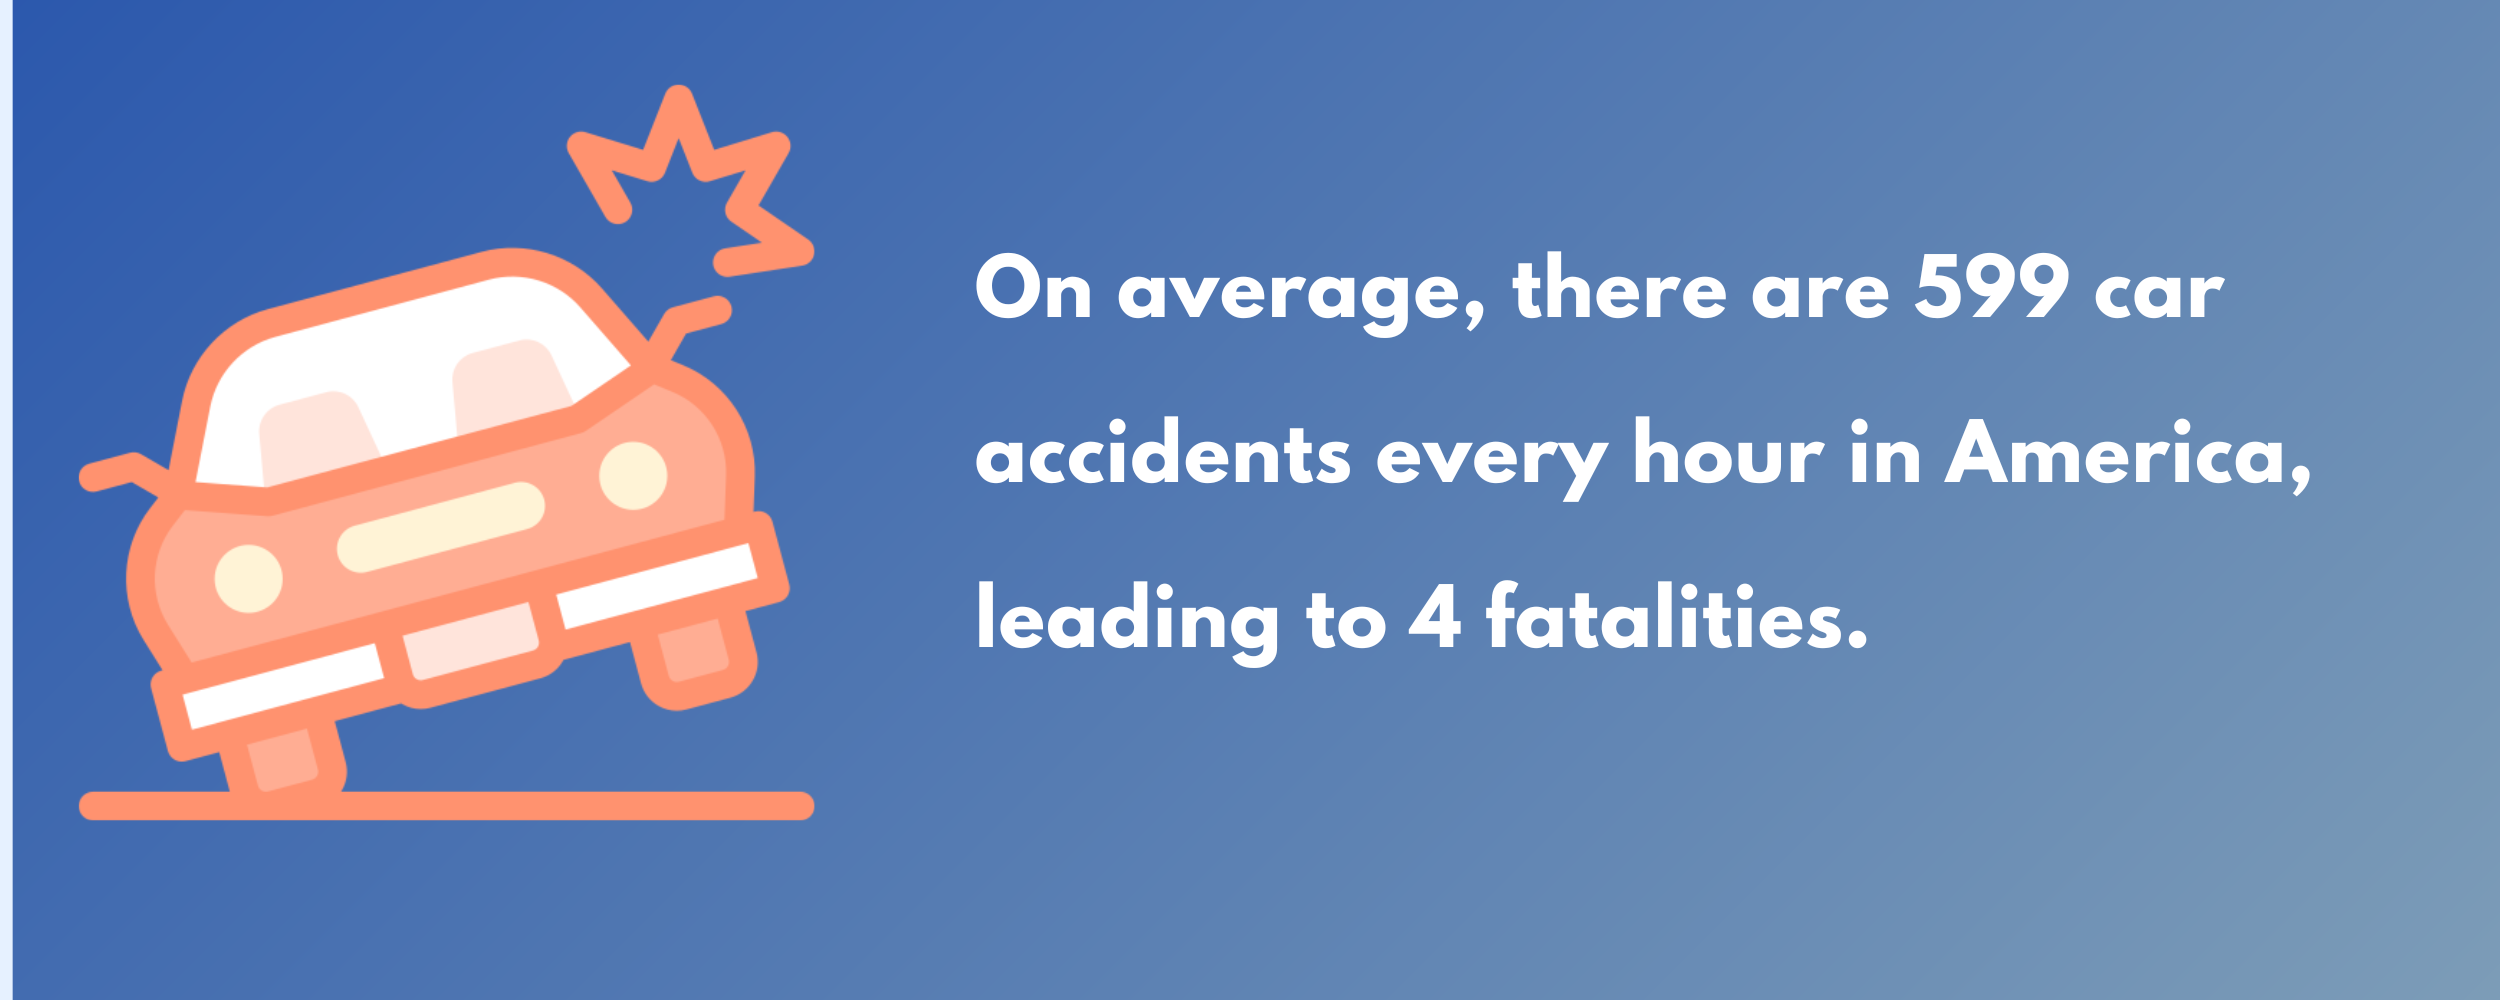
- 599 car accidents per hour
- 14,386 car accidents per day
- 437,570 car accidents per month
- 5,250,837 car accidents per year
HOW MANY PEOPLE DIE IN CAR ACCIDENTS?
Car accidents can have devastating consequences, with many resulting in fatalities. In 2020, the number of deaths caused by collisions in the U.S. was 38,824, the highest annual total since 2007. This figure works out to:
- 0.001 deaths per second (or 1 death every 812 seconds)
- 0.07 deaths per minute (or 1 death every 13.5 minutes)
- 4 deaths per hour
- 106 deaths per day
- 3,235 deaths per month
- 38,824 deaths per year
HOW MANY PEDESTRIANS DIE IN CAR ACCIDENTS?
Pedestrians account for 16.8% of the total 38,824 deaths caused by car accidents (6,516 deaths). They represent the second highest affected group, after drivers:
TRAFFIC CRASH VICTIMS | NO. OF DEATHS | % OF TOTAL |
Occupants | 25,536 | 65.8% |
Drivers | 19,519 | 50.3% |
Passengers | 5,966 | 15.4% |
Unknown | 51 | 0.1% |
Motorcyclists | 5,579 | 14.4% |
Nonoccupants | 7,709 | 19.9% |
Pedestrians | 6,516 | 16.8% |
Pedal cyclists | 938 | 2.4% |
Unknown | 255 | 0.7% |
Total | 38,824 | 100.0% |
This number calculates to one pedestrian dying every 81 seconds in the U.S. Pedestrians are particularly vulnerable in road traffic collisions as they have no protection from the force of impact, so the risk of severe injury or death is significant.
HOW MANY ACCIDENTS WILL THE AVERAGE DRIVER GET INTO IN A LIFETIME?
According to car insurance companies, the average driver in the U.S. is likely to be involved in at least one accident every 18 years of driving. Over a typical driving lifetime of 60 years, the average driver may experience approximately three to four accidents. However, it is important to note that individual experiences can vary widely depending on factors, such as driving habits, location, weather conditions, vehicle model, age, and other external variables.
WHEN DO MOST CAR ACCIDENTS HAPPEN?
Based on the 2020 NHSTA data, some patterns in the timing of car accidents have emerged.
- The highest number of car accidents occurred during the late afternoon and early evening hours, between 3 p.m. and 5.59 p.m. During that time, many people commute home from work or run errands, and there is typically more traffic on the roads.
- Most collisions resulting in injury or property damage happened on a Friday, but most fatal car accidents occurred on a Saturday. This trend is not unexpected because people are usually more tired and less alert by the end of the week. The end of the working week also signals when people indulge in evening entertainment and drink alcohol.
- Nine p.m. to 11:59 p.m. and 6 p.m. to 8:59 p.m. on Saturdays proved to be the deadliest 3-hour periods throughout 2020, with 1,158 and 1,122 fatal crashes, respectively.
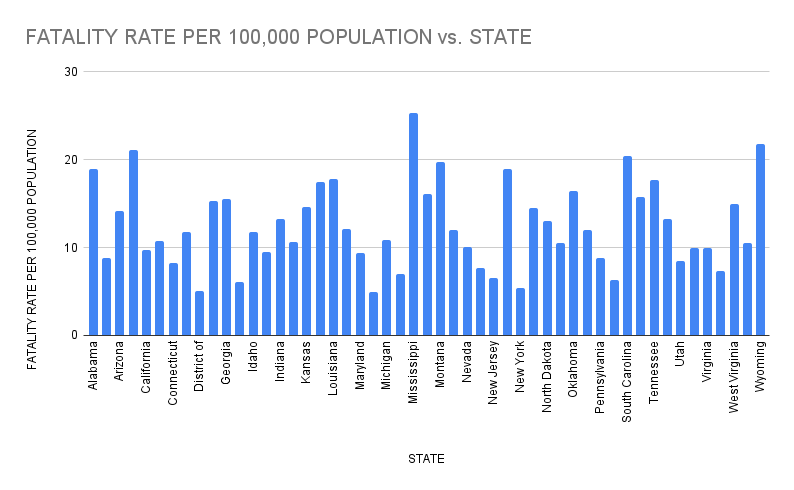
IN WHICH STATE DO MOST FATAL CAR ACCIDENTS HAPPEN?
The number and rate of fatal car accidents vary a lot between states. While Texas had the highest number of deaths caused by collisions in 2020 (3,874 deaths), Mississippi had the highest fatality rate, with 25.35 deaths per 100,000 population. Conversely, the District of Columbia registered just 36 deaths, and Massachusetts had the lowest fatality rate, with 4.98 deaths per 100,000 population.
NUMBER OF FATALITIES | ||||
STATE | 2019 | 2020 | % CHANGE | FATALITY RATE PER 100,000 POPULATION |
Alabama | 930 | 934 | 0.4% | 18.98 |
Alaska | 67 | 64 | -4.5% | 8.75 |
Arizona | 979 | 1,054 | 7.7% | 14.2 |
Arkansas | 511 | 638 | 24.9% | 21.05 |
California | 3,719 | 3,847 | 3.4% | 9.77 |
Colorado | 597 | 622 | 4.2% | 10.71 |
Connecticut | 249 | 295 | 18.5% | 8.29 |
Delaware | 132 | 116 | -12.1% | 11.76 |
District of Columbia | 23 | 36 | 56.5% | 5.05 |
Florida | 3,185 | 3,331 | 4.6% | 15.33 |
Georgia | 1,492 | 1,664 | 11.5% | 15.54 |
Hawaii | 108 | 85 | -21.3% | 6.04 |
Idaho | 224 | 214 | -4.5% | 11.71 |
Illinois | 1,009 | 1,194 | 18.3% | 9.49 |
Indiana | 810 | 897 | 10.7% | 13.28 |
Iowa | 336 | 337 | 0.3% | 10.65 |
Kansas | 410 | 426 | 3.9% | 14.62 |
Kentucky | 732 | 780 | 6.6% | 17.42 |
Louisiana | 727 | 828 | 13.9% | 17.82 |
Maine | 157 | 164 | 4.5% | 12.15 |
Maryland | 535 | 567 | 6.0% | 9.36 |
Massachusetts | 336 | 343 | 2.1% | 4.98 |
Michigan | 986 | 1,084 | 9.9% | 10.88 |
Minnesota | 364 | 394 | 8.2% | 6.96 |
Mississippi | 642 | 752 | 17.1% | 25.35 |
Missouri | 881 | 987 | 12.0% | 16.04 |
Montana | 184 | 213 | 15.8% | 19.71 |
Nebraska | 248 | 233 | -6.0% | 12.03 |
Nevada | 304 | 317 | 4.3% | 10.1 |
New Hampshire | 101 | 104 | 3.0% | 7.61 |
New Jersey | 558 | 584 | 4.7% | 6.57 |
New Mexico | 425 | 398 | -6.4% | 18.9 |
New York | 934 | 1,046 | 12.0% | 5.41 |
North Carolina | 1,457 | 1,538 | 5.6% | 14.51 |
North Dakota | 100 | 100 | 0.0% | 13.07 |
Ohio | 1,153 | 1,230 | 6.7% | 10.52 |
Oklahoma | 640 | 652 | 1.9% | 16.38 |
Oregon | 493 | 508 | 3.0% | 11.98 |
Pennsylvania | 1,059 | 1,129 | 6.6% | 8.83 |
Rhode Island | 57 | 67 | 17.5% | 6.34 |
South Carolina | 1,006 | 1,064 | 5.8% | 20.39 |
South Dakota | 102 | 141 | 38.2% | 15.79 |
Tennessee | 1,136 | 1,217 | 7.1% | 17.67 |
Texas | 3,619 | 3,874 | 7.0% | 13.19 |
Utah | 248 | 276 | 11.3% | 8.49 |
Vermont | 47 | 62 | 31.9% | 9.95 |
Virginia | 831 | 850 | 2.3% | 9.89 |
Washington | 538 | 560 | 4.1% | 7.28 |
West Virginia | 260 | 267 | 2.7% | 14.96 |
Wisconsin | 567 | 614 | 8.3% | 10.53 |
Wyoming | 147 | 127 | -13.6% | 21.81 |
USA | 36,355 | 38,824 | 6.8% | 11.78 |
WHICH DRIVERS ARE MORE LIKELY TO BE INVOLVED IN A CAR ACCIDENT?
The age and sex of drivers play an important factor in the probability of being involved in a crash. The 2020 NHSTA data shows that people aged 25-34 suffered the most injuries and deaths, accounting for 7,713 fatalities and 490,004 injured people. These numbers are more than double the figures for the 21-24 age group, which experienced 3,313 fatalities and 229,329 injured people. However, as there are fewer registered drivers in this lower age group, it actually has the highest rate of death and injury across all ages. This data supports the idea that younger, less experienced drivers are more likely to be involved in a collision than their older, more risk-averse counterparts.
The fatality rate per 100,000 population was lower for females than males in 2020. The injury rate based on population was higher for females in the younger age groups, but higher for males in the older age groups. These trends suggest that women are generally more careful drivers and less likely to adopt high-risk driving habits, such as driving under the influence of drugs or alcohol and ignoring traffic signals.
WHAT ARE THE MAIN CAUSES OF CAR ACCIDENTS?
Driving under the influence remains one of the top causes of collisions. In 2020, it contributed to 30% of all fatal crashes and 55% of fatal crashes that occurred from midnight to 2.59 a.m. Male drivers accounted for three times the number of deaths from DUI accidents – 39,393 deaths versus 13,033 committed by female drivers.
Speeding is also a significant factor in car accidents, increasing the risk of severe injury and death. In total, 29% of all fatal collisions occurred due to speeding drivers, accounting for 11,258 fatalities. Men are also more likely to drive too fast compared to women, with a recent survey showing that more male drivers are likely to switch lanes quickly than female drivers (31.5% versus 21.4%).
Conclusion
Car accidents remain a leading cause of preventable death in the U.S., with a reported collision occurring every six seconds. These accidents result in numerous fatalities, injuries, and property damage, causing immense financial and emotional stress to the affected individuals and their families.
It is crucial to implement and enforce strict traffic regulations, including speeding limits, seat belt laws, and drunk driving laws, to minimize the number of accidents and ensure the safety of all road users.
Additionally, adopting safe driving habits such as avoiding distracted driving, maintaining a safe distance from other vehicles, and obeying traffic signals can go a long way in preventing accidents.
