When it comes to driving, the age-old question of who is better behind the wheel—men or women—has sparked endless debates and discussions. The gender stereotypes of speed-loving, reckless male drivers and careful, law-abiding female drivers persist – but how much do they reflect reality?
In this article, we will explore the latest data and statistics about male and female drivers, covering driving patterns, car accidents, road rage, risky behaviors, and more.
KEY INSIGHTS
- Statistically, women are safer drivers than men
- In 2020, 75% of fatal crashes involved male drivers
- Female drivers have a higher fatality rate in serious accidents than men
- For every 100 million miles travelled men have a crash rate of 2.1, while women have a crash rate of 1.3. Simply put, men are 61% more likely to get into an accident than women
- On average, men drive 62% more than women (16000 vs 10000 miles) and account for 59% of vehicle accidents
- Of the 9,125,456 drivers involved in all road traffic accidents in 2020, 41% were female (3,728,795 motorists), and 59% were male (5,395,197 motorists)
- More than three times as many male drivers were involved in fatal car crashes in 2020 compared with female drivers (39,393 motorists vs 13,033 motorists)
- In 2021, there were marginally more female licensed drivers in the U.S. than male licensed drivers, with 117.6 million female licensees compared to 115.2 million male licensees (50.5% vs 49.5%)
- Based on 2017-2020 data, men accounted for 73% of all traffic violations and 75% of speeding offenses
- 58% of the drivers involved in non-fatal injury car crashes in 2020 were male, and 42% were female (1,646,716 motorists vs 1,194,171 motorists)
- 47% more male drivers were involved in property-only crashes in 2020 than female drivers (3,709,088 motorists vs 2,521,591 motorists)
- 22% of male drivers in fatal crashes in 2020 had a blood alcohol concentration (BAC) of at least 0.8. In contrast, only 16% of female motorists in fatal crashes drove with a BAC of at least 0.8
- Taking into account all accident types (fatal, injury only, and property damage only), the highest driver involvement rate is amongst male drivers aged 16-20 years (10,252 drivers involved in crashes per 100,000 licensed drivers)
- 37.8% of male drivers admitted in a 2020 survey that they had followed the vehicle in front closely to prevent another vehicle from merging. Females drivers also engaged in this aggressive driving behavior, but far fewer – only 29.3%
- Almost a third of male drivers in 2020 reported driving aggressively by switching lanes quickly or very close behind another car, whereas only 1 in 5 female drivers admitted to doing the same
- A 2019 survey revealed that men (32.9%) were more likely to have fallen asleep at the wheel compared to women (22.2%)
DRIVER DEMOGRAPHICS AND CAR USAGE
Although the number of licensed drivers in 2021 was split almost equally between men (115.2 million licensees) and women (117.6 million licensees), women buy 62% of all new cars sold in the U.S. and influence more than 85% of all car purchases.
However, male drivers spend most time behind the wheel – on average, they drive 6,000 more miles annually than female drivers. Men aged 34-54 drive the most out of everyone, clocking up almost 19,000 miles each year. On the opposite end of the scale, women over 65 drive the least, traveling less than 5,000 miles every year. Even when comparing the same age group – people of working age – men drive about 7,500 more miles than women each year.
The reasons for this disparity are rooted in traditional gender roles. According to the American Time Use Study, women spend more time at home doing household activities, while men spend more time at work. So while men may have long commutes to their workplace, women make shorter trips related to domestic responsibilities: dropping children at school, running errands, etc. Additionally, men are more likely to drive as a leisure activity or as a job in a taxi, truck, or bus (only 17.6% of drivers are female in the U.S.).
WHO CAUSES MORE CAR ACCIDENTS?
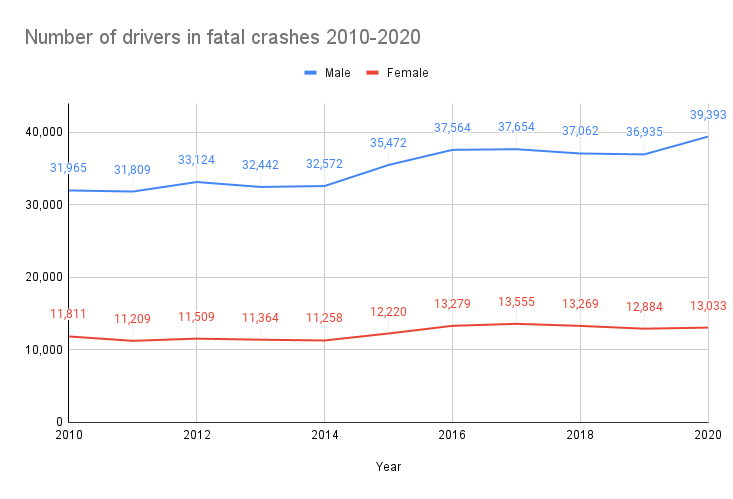
Male motorists represented 59% of drivers involved in all car crashes in 2020 (5,395,197 drivers vs 3,728,795 female drivers). For non-fatal and property damage-only crashes, men comprised roughly the same ratio of the drivers – 58% and 60% respectively. But the most worrying statistic is that 75% of those behind the wheel in fatal road traffic accidents were men.
Between 2010 and 2020, there was an overall increase in fatal car accidents for both genders but the percentage increase was greater among male drivers (+23% vs +10% for female drivers), with 2020 representing the highest number of male motorists involved in deadly accidents in those ten years.
| Number of Drivers in Fatal Crashes | ||
| Year | Male | Female |
| 2010 | 31,965 | 11,811 |
| 2011 | 31,809 | 11,209 |
| 2012 | 33,124 | 11,509 |
| 2013 | 32,442 | 11,364 |
| 2014 | 32,572 | 11,258 |
| 2015 | 35,472 | 12,220 |
| 2016 | 37,564 | 13,279 |
| 2017 | 37,654 | 13,555 |
| 2018 | 37,062 | 13,269 |
| 2019 | 36,935 | 12,884 |
| 2020 | 39,393 | 13,033 |
DOES AGE AFFECT CAR ACCIDENT RATES?
Age appears to have the same influence on drivers irrespective of gender – the younger and more inexperienced the driver, the higher the involvement rate in accidents of all types (fatal, injury only, and property damage only).
The highest actual number of drivers involved in accidents for both males (1,229,148 drivers) and females (884,518 drivers) is within the 25-34 age category as it is the largest group of licensed drivers, as highlighted in the below table:
| Driver Involvement Rates per 100,000 Licensed Drivers, by Age Group & Sex in All Crashes | ||||||
| Male | Female | Total | ||||
| Age Group | Drivers | Involvement Rate | Drivers | Involvement Rate | Drivers | Involvement Rate |
| <16 | 25,979 | ** | 16,197 | ** | 42,177 | ** |
| 16-20 | 599,418 | 10,252 | 474,816 | 8,360 | 1,074,237 | 9,320 |
| 21-24 | 550,790 | 7,732 | 418,137 | 6,045 | 968,931 | 6,901 |
| 25-34 | 1,229,148 | 6,171 | 884,518 | 4,426 | 2,113,682 | 5,297 |
| 35-44 | 938,826 | 4,961 | 627,085 | 3,252 | 1,565,920 | 4,098 |
| 45-54 | 804,705 | 4,344 | 496,277 | 2,633 | 1,300,991 | 3,481 |
| 55-64 | 691,833 | 3,579 | 424,679 | 2,114 | 1,116,519 | 2,833 |
| 65-74 | 372,548 | 2,580 | 256,642 | 1,663 | 629,193 | 2,106 |
| >74 | 181,816 | 2,149 | 130,411 | 1,397 | 312,229 | 1,755 |
| Unknown | 135 | ** | 33 | ** | 1,577 | ** |
| Total | 5,395,197 | 4,792 | 3,728,795 | 3,226 | 9,125,456 | 3,999 |
IS ROAD RAGE A MALE ISSUE?
Many people assume that men are the main perpetrators of road rage. However, a recent survey by the American Automobile Association found that women admit to the same behaviors – although not to the same extent. Regardless of gender, nearly 8 in 10 drivers resort to aggressive driving behaviors. The survey results by gender are in the below table:
Aggressive Driving Behaviors among Male and Female U.S. Drivers, 2019 | ||
Type of behavior | Male | Female |
Drove 15 mph over the speed limit on a freeway | 52.0% | 44.6% |
Followed the vehicle in front closely to prevent another vehicle from merging | 37.8% | 29.3% |
Made rude gesture/honked at another driver | 35.4% | 28.0% |
Drove through a red light | 32.2% | 30.0% |
Drove aggressively by switching lanes quickly and/or very close behind another car | 31.5% | 21.4% |
Overall, the survey found that both younger male and female drivers tended to be more combative than their older counterparts. External pressures such as stress and time constraints, combined with poor driving conditions such as traffic and diversions, can cause even the calmest person (male or female) to lose their cool.
SPEEDING
Speeding is the most prevalent aggressive behavior and also the most dangerous. The likelihood of causing death increases exponentially at faster speeds:
- Hit at 23 mph, 10% of people will die
- Hit at 32 mph, 25% of people will die
- Hit at 50 mph, 75% of people will die
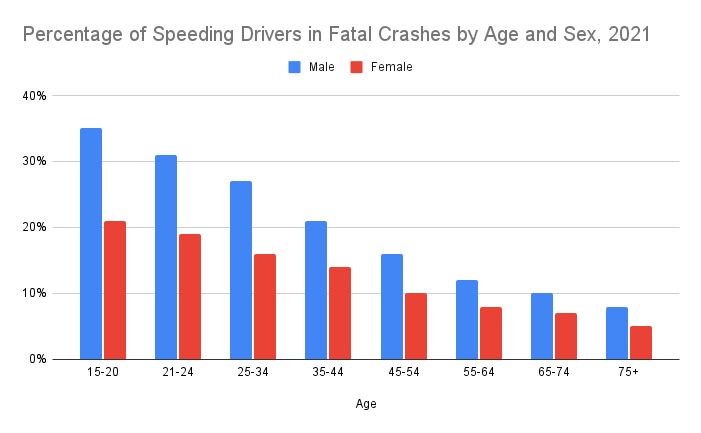
According to the Insurance Institute for Highway Safety, speeding was a contributing factor for a greater percentage of male drivers than female drivers involved in fatal crashes every year from 1982 to 2021. In 2021, it was identified as a factor in 20% (6,607 cases) of male motorists involved in fatal crashes compared with 13% of female motorists (1,187 cases).
For both genders, the proportion of fatal crashes involving speeding decreases with age. Young male drivers in the 15-20 and 21-24 year age groups were the most likely to be speeding at the time of fatal crashes, accounting for at least 31% of male drivers compared to just 19% of female drivers in the same age groups.
| Percentage of Speeding Drivers in Fatal Crashes by Age and Sex, 2021 | ||
| Age | Male | Female |
| 15-20 | 35% | 21% |
| 21-24 | 31% | 19% |
| 25-34 | 27% | 16% |
| 35-44 | 21% | 14% |
| 45-54 | 16% | 10% |
| 55-64 | 12% | 8% |
| 65-74 | 10% | 7% |
| 75+ | 8% | 5% |
It is no surprise then that men are 13% more likely to receive tickets for speeding than women. In some states, the disparity is even greater, with men in Minnesota said to receive at least 50% more speeding tickets than women across every age group.
OTHER RISKY BEHAVIORS
Statistics show that women are much less likely to get behind the wheel while under the influence of alcohol. In 2020, 16% of female drivers in fatal crashes had a BAC of 0.8+, in contrast to 22% of male drivers. In addition to drink-driving, men are more likely to drive without wearing a seatbelt. Studies have shown that 88% of male front-seated occupants use a seatbelt whereas 93% of female occupants ensure they are strapped in.
The increased likelihood of speeding, not using a seatbelt, and driving under the influence of alcohol goes a long way to explaining why many more men end up in car accidents, severely injured, or dead.
But what drives men to indulge in risky behaviors more readily than women? Theories range from:
- Biological – testosterone encourages risk-taking behavior and impulsivity
- Psychological – boys are encouraged to play with cars from a young age, setting in place a familiarity that later leads to increased confidence when driving
- Material – Men tend to choose bigger, more powerful cars than women
Conclusion - Women are safer drivers than Men
There is no doubt that, in general, men and women take a different approach to driving. Accident statistics and studies show that more women abide by the law and drive more cautiously than men. However, they are not immune from resorting to risky behaviors such as speeding, switching lanes aggressively, and driving under the influence.
Additionally, men are more likely to be involved in car accidents simply because they spend more time driving than women. Regardless of gender, it is the responsibility of all motorists to drive responsibly and keep all road users safe.
This report has been carefully compiled by LookupAPlate — A platform to lookup license place in the US and report bad drivers. If you reference or share the statistics from this page, we kindly request that you credit us by including a hyperlink to this page or our homepage.
Sources:
- https://www.fhwa.dot.gov/policyinformation/statistics/2021/dl220.cfm
- https://crashstats.nhtsa.dot.gov/Api/Public/ViewPublication/813375
- https://newsroom.aaa.com/2020/12/survey-says-men-are-more-aggressive-behind-the-wheel/
- www.thezebra.com/resources/research/drowsy-driving-statistics/
- https://www.forbes.com/sites/jennifernewman/2019/05/30/its-true-women-really-do-shop-more-for-cars/?sh=805b4b13a0c6
- https://www.kbb.com/car-advice/average-miles-driven-per-year/
- https://www.bls.gov/news.release/atus.t08A.htm
- https://crashstats.nhtsa.dot.gov/#!/DocumentTypeList/12
- https://newsroom.aaa.com/2020/12/survey-says-men-are-more-aggressive-behind-the-wheel
- https://nacto.org/publication/city-limits/the-need/speed-kills/
- https://www.iihs.org/topics/fatality-statistics/detail/males-and-females#speeding
- https://injuryfacts.nsc.org/motor-vehicle/motor-vehicle-safety-issues/speeding/
- https://www.iihs.org/topics/seat-belts.
