Few countries are as car-obsessed as America. With millions of cars on the road, Americans drive trillions—yes, trillions—of miles each year. Together, we’re covering some serious ground and racking up the miles on our odometers. The latest data indicates we drove a combined total of 3.69 trillion miles in 2025 alone.
On an individual level, the average American drives about 13,562 miles each year. This, of course, depends on a number of factors such as age, location, and driving habits, to name a few.
Below, read all about the many miles we’re driving.
Key takeaways
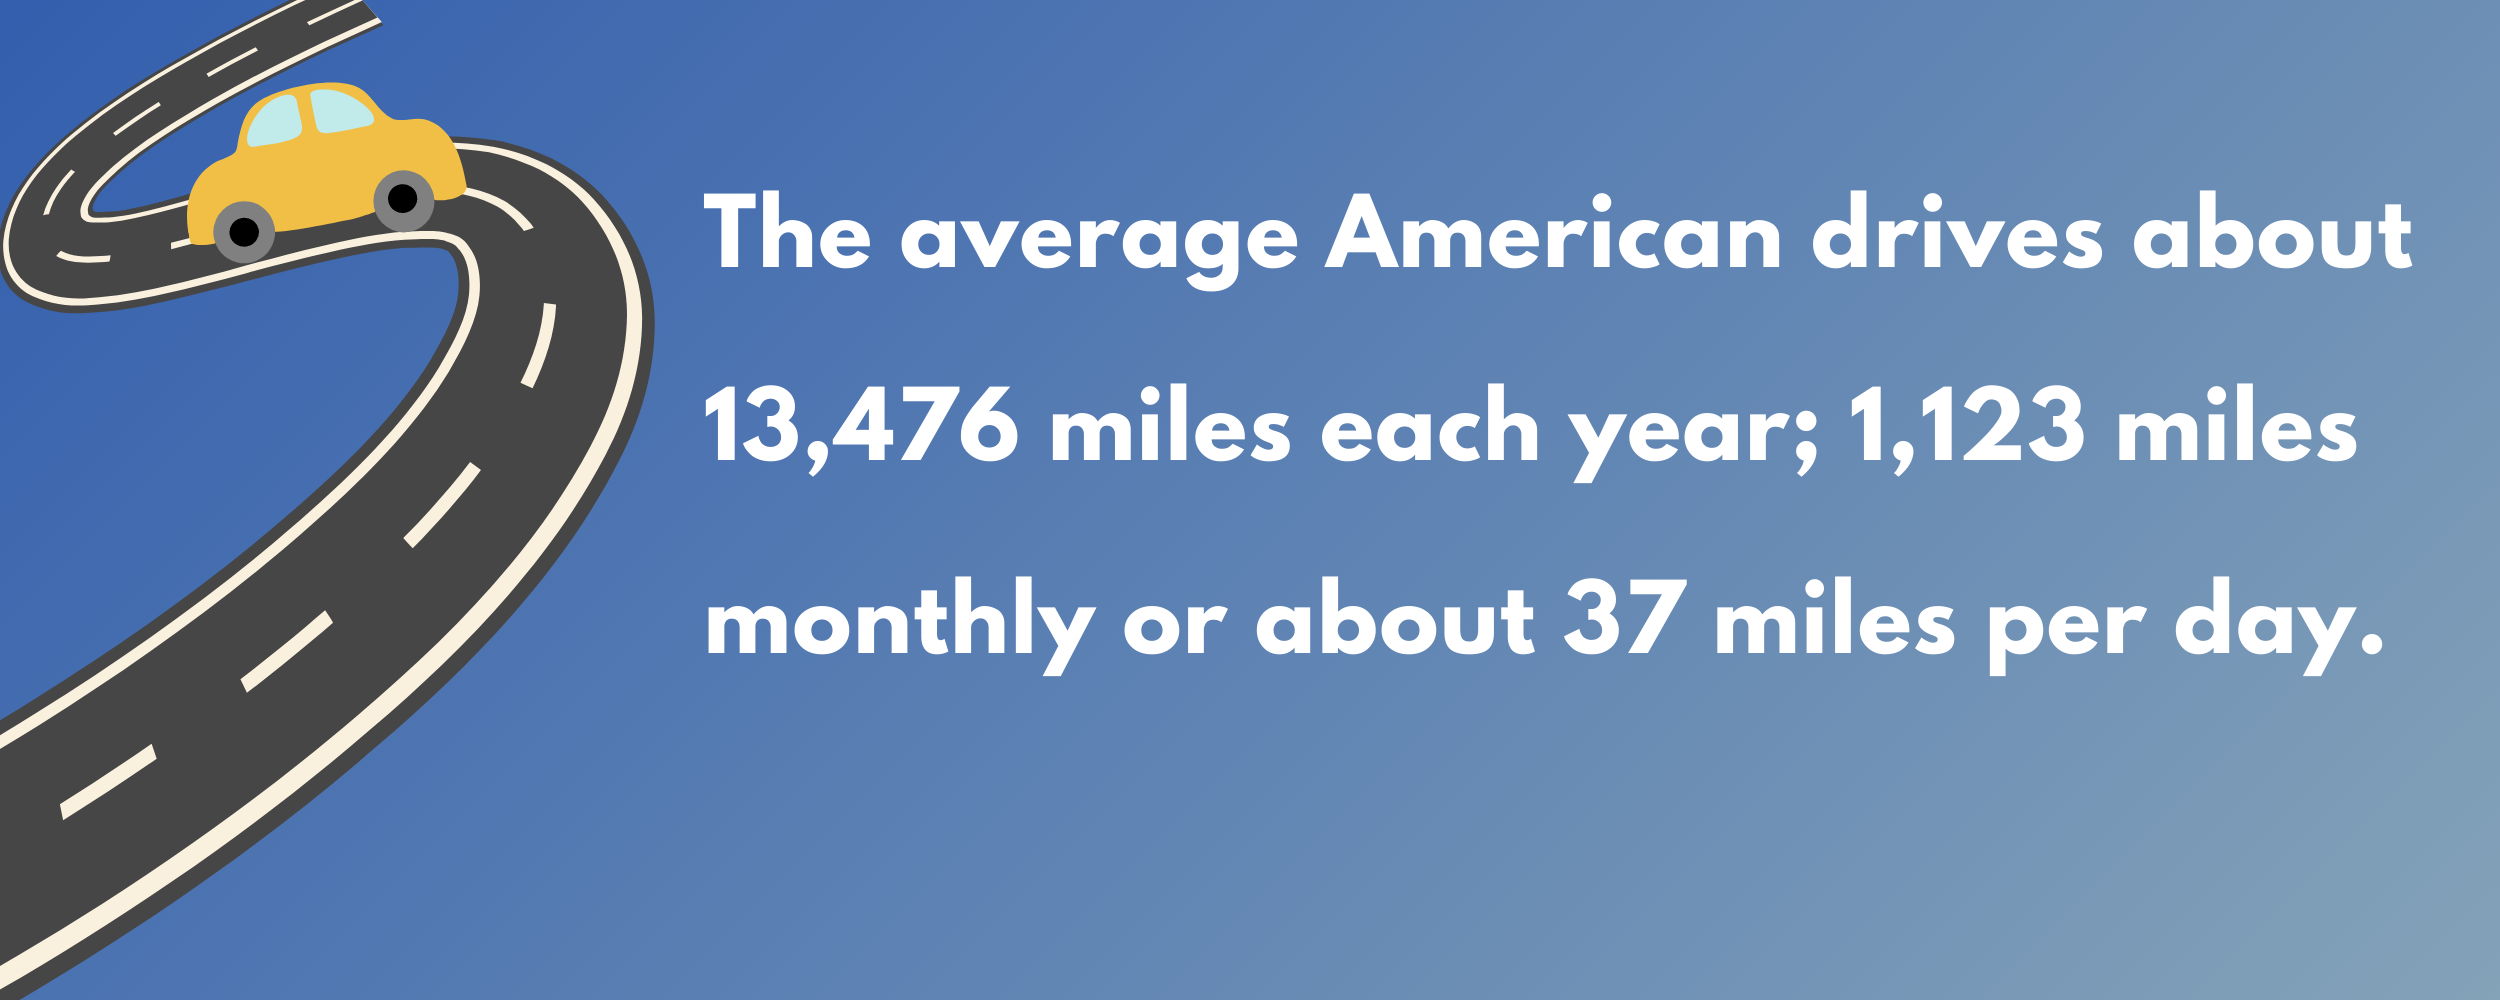
- The average American drives about 13,476 miles each year which equates to 1,123 miles monthly or about 37 miles per day
- The average driver is behind the wheel for up to 55 minutes per day
- Over the course of the year, an average American spends two weeks behind the wheels
- Men drive an average of 6,000 more miles per year than women
- Combined Americans drive about 3.26 trillion miles per year and this number is expected to increase by 22% by 2049
- Together, we drive about 11 billion miles a day
- Wyoming drives the most, averaging 24,069 miles per driver each year
- Washington, D.C. drives the least, averaging 7,013 miles per driver each year
- Those ages 35-54 drive more than any other age group, averaging 15,291 each year
- Men ages 35-54 drive the most, while females ages 65+ drive the least
How many miles do Americans drive on average?
As previously stated, the average American drives about 13,476 miles each year. That’s more than two round-trip drives from New York City to Los Angeles and back. Or, you could drive the estimated 7,194 miles around the country from New York City to Chicago, Seattle, Los Angeles, Houston, Atlanta, and back to New York City—almost twice.
Another way to look at this is to put it into the context of time:
- Together American drivers spend about 160 million hours on the road daily
- American drivers spend between 46 and 55 minutes in the car per day
- To put in perspective, a typical American driver spends about seven 40-hour weeks behind the wheel every year.
According to the FHWA’s National Vehicle Miles Traveled forecast, our collective mileage is expected to increase by 22% over the current 30-year forecast period, which ends in 2049.
Further, the average American drives an estimated:
- 1,123 miles per month
- 281 miles per week
- 37 miles per day
While the monthly, weekly, and even daily averages may not seem all that surprising (we are used to driving, after all), they’re a bit more shocking when compared to other countries.
Worldwide averages
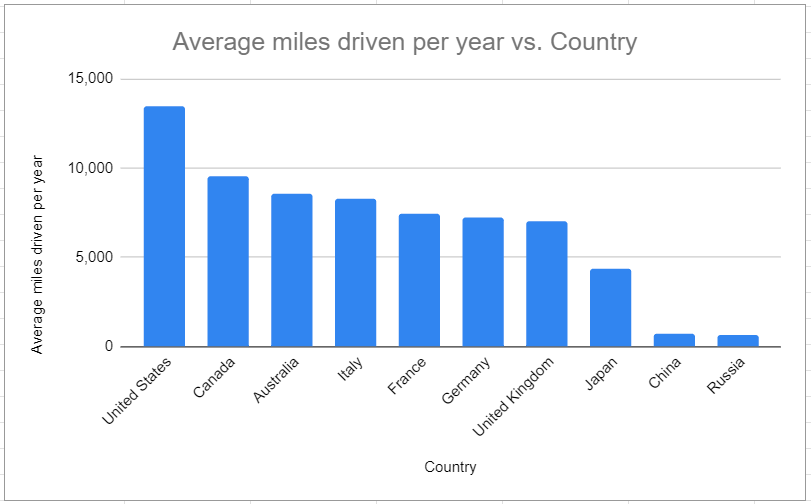
According to our research, we put in more miles than quite a few countries. In fact, Americans drive almost 4,000 miles more than Canadians per year on average, which is nearly 30% more than the average Canadian driver.
See how the U.S. stacks up against several other countries by average miles driven per person per year:
- United States: 13,474
- Canada: 9,562
- Australia: 8,555
- Italy: 8,256
- France: 7,424
- Germany: 7,209
- United Kingdom: 6,987
- Japan: 4,381
- China: 697
- Russia: 613
Interestingly enough, 6 of the above countries (Canada, Australia, France, Germany, China, and the United Kingdom) were included in the top 20 list of the Global Bicycle Cities Index 2022, with as many as 7 German cities featured in the top 20. A handful of U.S. cities made the list, which includes 90 cities in total; however, none made it to the top 10 or top 20. Perhaps if we adopted some of the infrastructure which allows for more bike-friendly cities (or more widespread public transportation), we might see mileage rates that are more comparable to other countries on the above list.
Mileage by state
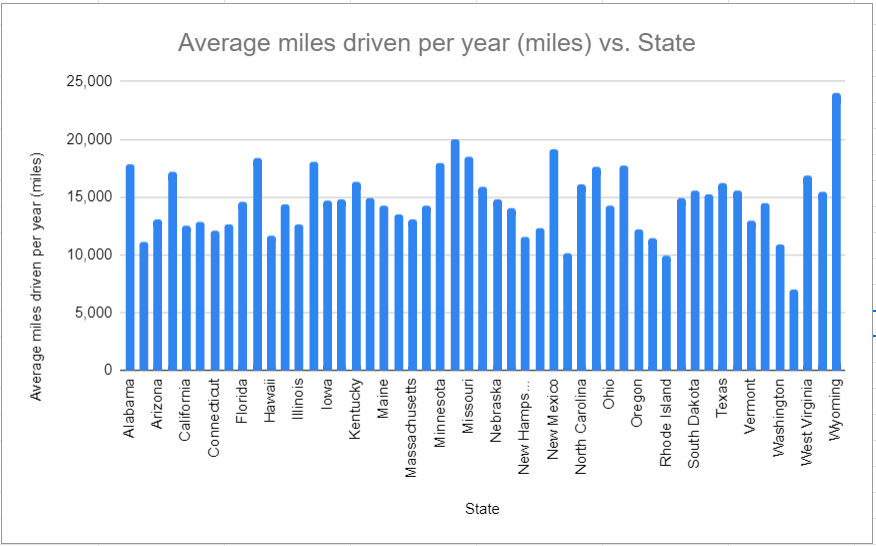
Within the U.S., however, mileage varies by state. Below, see the average annual miles per driver in each state (most recent data from the FHWA):
- Alabama: 17,817
- Alaska: 11,111
- Arizona: 13,090
- Arkansas: 17,224
- California: 12,524
- Colorado: 12,899
- Connecticut: 12,117
- Delaware: 12,609
- Florida: 14,557
- Georgia: 18,334
- Hawaii: 11,688
- Idaho: 14,417
- Illinois: 12,581
- Indiana: 18,024
- Iowa: 14,745
- Kansas: 14,781
- Kentucky: 16,305
- Louisiana: 14,951
- Maine: 14,215
- Maryland: 13,490
- Massachusetts: 13,109
- Michigan: 14,307
- Minnesota: 17,909
- Mississippi: 19,966
- Missouri: 18,521
- Montana: 15,880
- Nebraska: 14,846
- Nevada: 14,016
- New Hampshire: 11,570
- New Jersey: 12,263
- New Mexico: 19,157
- New York: 10,167
- North Carolina: 16,073
- North Dakota: 17,671
- Ohio: 14,278
- Oklahoma: 17,699
- Oregon: 12,218
- Pennsylvania: 11,445
- Rhode Island: 9,961
- South Carolina: 14,941
- South Dakota: 15,541
- Tennessee: 15,287
- Texas: 16,172
- Utah: 15,516
- Vermont: 13,004
- Virginia: 14,509
- Washington: 10,949
- Washington, D.C.: 7,013
- West Virginia: 16,876
- Wisconsin: 15,442
- Wyoming: 24,069
Keep in mind that the average American drives about 13,476 miles each year, so it’s interesting to see which states are driving both above and below the national average.
States that drive the most on average
When looking at the states that drive the most, we’ve listed the top five states with the highest average miles per year below:
- Wyoming: 24,069 miles per driver
- Mississippi: 19,966 miles per driver
- New Mexico: 19,157 miles per driver
- Missouri: 18,521 miles per driver
- Georgia: 18,334 miles per driver
Based on the above data, Wyoming residents are clearly driving the most, nearly twice the national average. And this makes sense, as Wyoming, like other states on the top-five list, is quite rural. Without the same public transportation or bicycle lanes that more urbanized states have, the people of Wyoming would undoubtedly be more car-dependent.
States that drive the least on average
Alternatively, the five states with the lowest average miles per year are all below the national average:
- Washington, D.C.: 7,013 miles per driver
- Rhode Island: 9,961 miles per driver
- New York: 10,167 miles per driver
- Washington: 10,949 miles per driver
- Alaska: 11,111 miles per driver
Fuel prices and the availability of public transportation seem to impact the states with the lowest average miles per year. For example, New York and Washington, D.C. have some of the country’s most sophisticated public transportation systems in the country. Elsewhere, in states such as Alaska and Washington, gas prices are some of the highest per gallon, which would deter residents from putting in more miles (U.S. News).
How much do Americans spend on gas?
If gasoline is a key contributing factor in vehicle miles traveled, it makes sense to explore gasoline prices. See some of our key findings below.
- Americans spend $150 to $200 on gas each month—almost 2.24% of monthly incomes (J.D. Power)
- Americans spend up to $5,000 on gas annually (J.D. Power)
Of course, gas prices vary from state to state and depend on a number of other factors, including seasonality and international conflict. Further, the more we drive, the more we’ll spend on gas. Additionally, some cars, such as pickup trucks and SUVs, are notorious gas guzzlers, while hybrids and other fuel-efficient cars offer drivers some level of reprieve. But, ultimately, gas prices fluctuate greatly.
- As of January 2025, gas prices increased by 14% over the last year
- In 2025 alone, Americans spent an estimated $496 billion on gasoline, which is close to double the amount spent before prices had risen in 2020
Regarding the average price per gallon, AAA notes the following:
- The national average was around $2.90 for regular unleaded gas in December 2025
- In 2024, the national average was $3.30
- By June 2022, the national average hit a record high of $5.016
Comparatively speaking, we haven’t seen average prices over $5 since 2008. That year, the average cost of gasoline per gallon was, when adjusted for inflation, at about $5.1, according to the Department of Energy. Between 2011 and 2014, the average price dipped a bit at about $4-$5 per gallon, again adjusted for inflation. April 2020 saw the lowest gasoline prices in recent years, which makes sense as the country was hunkered down due to the pandemic.5
When and where are we driving?
Despite the fluctuation in gas prices, it’s clear that we’re often on the road. But where, exactly, are we going?
Below, see why we drive, according to the most recent National Household Travel Survey by the BTS:
- Shopping and errands: 45% of daily trips
- Social and recreational: 27% of daily trips
- Commuting: 15% of daily trips
While the commuting statistics may seem surprising, these stats center around number of trips, not amount of time, and the typical work day involves two daily trips: one to work and one home.
Daily travel comparison
Do we travel more during different times throughout the day or days of the week? According to the BTS, we do, indeed.
- Most (16%) daily trips are made on Fridays
- The fewest (13%) daily trips are made on Sundays
- More daily trips are taken between 12-1 PM (7.4%) than 8-9 AM (5.5%)
The demographics effect
To dive deeper into who is driving the most, it’s important to examine how demographics affect driving.
Below, see the total average miles driven per year by age:
- 16-19: 7,624
- 20-34: 15,098
- 35-54: 15,291
- 55-64: 11,972
- 65+: 7,646
Overall, we drive more miles the older we get until around age 55, when our miles driven tends to decrease. Unsurprisingly, those in age brackets likely to be making the daily commute to work drive the most (20-64). Conversely, those in high school or early college as well as those of retirement age drive less. Specifically, those ages 35-54 drive the most, while those ages 16-19 drive the least.
Males drive more per year than their female counterparts
Average miles driven by male driver:
- 16-19: 8,206
- 20-34: 17,976
- 35-54: 18,858
- 55-64: 15,859
- 65+: 10,304
Average miles driven by female driver:
- 16-19: 6,873
- 20-34: 12,004
- 35-54: 11,464
- 55-64: 7,780
- 65+: 4,785
Interestingly, men drive more than women overall, averaging about 6,000 more miles than women per year (see below). Men ages 35-54 drive the most, while females ages 65+ drive the least.
- Total average miles driven per year by males, according to the FHWA, is 16,550
- Total average miles driven per year by females, according to the FHWA, is 10,142
Annual trends
As they say, the best predictor of future behavior is past behavior. Over the years, the number of miles driven has increased exponentially, and that isn’t likely to stop anytime soon.
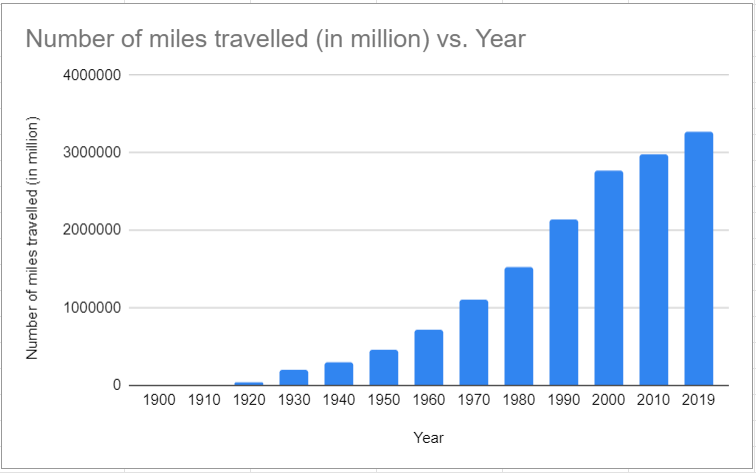
Vehicle miles traveled in millions (FHWA):
- 1900: 100
- 1910: 3,580
- 1920: 47,600
- 1930: 206,320
- 1940: 302,188
- 1950: 458,246
- 1960: 718,762
- 1970: 1,109,724
- 1980: 1,527,295
- 1990: 2,144,362
- 2000: 2,764,484
- 2010: 2,985,095
- 2019: 3,276,482
Over the last few decades alone, the total number of miles driven per year has nearly tripled. And, if we look at the 1950s as the birth of U.S. car culture, we’re driving 615% more today than we were then!
Closing thoughts
In sum, we’re driving far more now than ever before. If you’re a licensed driver, you’re likely putting in more miles than you think, averaging more than 13,000 miles per year. Looking at both past behavior and future estimations, it looks like we’re only slated to drive more in the coming years. Whether you’re currently driving more or less than the national average, we hope this information helps you better understand your own driving habits as well as those around you.
