With over 278 million registered vehicles and a staggering 91.7% of American households owning at least one car as of 2021, it is no secret that the United States is a country that relies on cars more than most. But how does the vast number of vehicles on the road correlate with the amount of time drivers spend in their cars?
In this study, we have compiled the latest data to find out just how long Americans spend in their vehicles, who spends the most time behind the wheel, and why. We will also explore current driving trends and habits, including the worrying consequences of society’s reliance on cars.
HOW MUCH TIME DO AMERICANS SPEND DRIVING?
As life expectancy has increased over the years, Americans are driving for longer than ever before. But how many days do people spend in their cars over the course of their lifetime? We break down the key pieces of data to reveal the surprising results:
- A recent survey showed that Americans of every generation believe that 21 is the ideal age to buy or lease their first car
- Due to failing health in old age, studies have shown that, on average, men have to stop driving five or six years before they die, and women have to stop even earlier – 10 years before they die
- Based on a current life expectancy in the United States of 76.4 years, the average person would stop driving at approximately 69 years old
- Assuming people buy or lease their first car at 21 years old and stop driving at 69 years old, people can expect to be driving over the course of 48 years of their lifetime
- In the latest American Automobile Association (AAA) Driving Survey, Americans reported spending an average of 61.3 minutes per day driving in 2021
- We also factor in that Generation X commuters do 34% less driving than millennials.
- Using the 2021 daily average, Americans spend:
- 1.3 days per month driving
- 15.5 days (22,320 minutes) per year driving
- 745.8 days (or approximately two years) over the course of a lifetime driving
15 ESSENTIAL DRIVING STATISTICS
- In 2021, there were 278 million registered vehicles and 258 million people aged 18 and over in the United States, equating to 1.08 cars for every adult
- The Department of Transportation revealed that in 2021, the average driver traveled 37 miles per day. This figure works out to:
- 1,124 miles traveled per month (the approximate driving distance from New York, NY to Tampa, FL)
- 13,489 miles traveled per year (just over half the distance around the world)
- 647,472 miles traveled over a lifetime (the distance 26 times around the world)
- Men typically drive 6,000 more miles per year than women
- Men aged 34-54 drive the most out of everyone, clocking up almost 19,000 annual miles
- Women over 65 drive the least, traveling less than 5,000 miles every year
- According to INRIX, the average U.S. motorist spent 51 hours stuck in traffic in 2022, an increase of 42% versus 2021, but still significantly below the pre-pandemic high of 99 hours in 2019
- Chicago is the 2nd worst city in the world for traffic congestion, just behind London, with Chicagoans spending an average of 155 hours in traffic jams in 2022
- Many cities saw an annual increase in car travel from the suburbs to downtown areas in 2022, as more people returned to work in the office during the day and enjoyed leisure opportunities at night. The cities that saw the largest increase in city center trips versus 2021 were:
- Washington, D.C. +23%
- Charlotte +19%
- Detroit +18%
- New York +17%
- San Diego +17%
- According to the AAA, motorists took 2.56 trips per day by car in 2021, up from 2.37 daily trips in 2020
- Although women usually drive less distance than men, they use cars more frequently on a daily basis, taking 2.59 trips per day in 2021 versus men’s 2.35 daily trips
- Given that Americans hold on to their cars for eight years on average, drivers can expect to own eight cars during their lifetime
- The last National Household Travel Survey carried out by the Department of Transportation reported the purposes for trips in a private vehicle are:
- Shopping and Errands – 41.2%
- Social and Recreational – 25.7%
- To and From Work – 18.6%
- School or Church – 9.3%
- Other – 3.6%
- Work-Related Business – 1.6%
- The average driver in the United States is likely to be involved in at least one accident every 18 years of driving. During a typical driving lifetime of 48 years, this works out to two or three accidents
- With around 41 million speeding tickets issued annually and 232.8 million licensed drivers on the roads, motorists have an 18% chance of paying a fine each year
- The average American spends between $150-$200 on gas every month. This figure works out to:
- $1800 – $2400 spent on gasoline per year
- $86,400 – $115,200 spent on gasoline over the course of a lifetime
GEN-Z HOLDS OFF LEARNING TO DRIVE
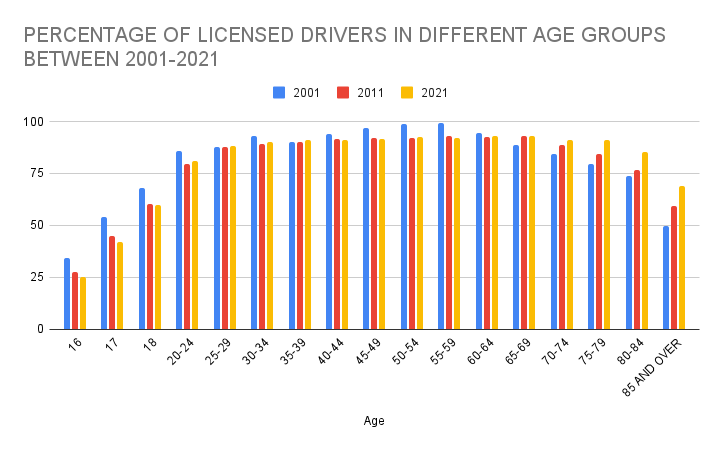
Once seen as the ultimate teen rite of passage, today’s adolescents are not as eager to take to the wheel. Although the minimum age for a full unrestricted driver’s license is less than 18 years old in 70% of states (the minimum age is 16 in 16 states and 17 in 19 states), only 25.3% of 16-year-olds and 42.1% of 17-year-olds were license holders in 2021.
The majority of 18-year-olds (59.7%) were fully licensed drivers in 2021 however, this number has fallen steadily over the years, as shown in the below chart illustrating the change in the percentage of licensed drivers in different age groups between 2001-2021:
The reasons for this shift in the behavior of teenagers are numerous and complex. We have summarised the key drivers:
- Policy changes. To increase road safety, most states have made getting a license more difficult by introducing graduated driver licensing. This policy requires learner drivers to pass through multiple stages with strict requirements before becoming fully licensed
- Economic status. Fewer teenagers have part-time jobs than in the past so they cannot independently afford the cost of buying and running a car
- Public transportation. Increased urbanization means that young people have greater access to mass transportation systems
- Environmental concerns. A more heightened awareness of environmental issues and concern for their future encourages young people to walk or use public transportation
- Technology. The growth of ride-share services, social media, and online shopping has radically reduced the need to drive
IS CAR-CENTRIC CULTURE KILLING AMERICANS?
Despite being one of the most economically developed countries in the world, a study by Oxford University revealed that the United States ranks 53 in the world for life expectancy, lower than any of the G7 countries (Canada, France, Germany, Italy, Japan, the United Kingdom, and the United States). One of the main reasons cited for this poor performance is American society’s reliance on cars. Most cities are designed with motorists in mind, making walking an impractical or unattractive choice. Notable exceptions to this rule are New York City, San Francisco, Boston, and Baltimore, however, only 5% of the population live in these areas.
With only 3% of commuters opting to walk to work compared with 76% of workers who choose to drive daily, the average American does not get enough physical exercise in a day to lead a healthy lifestyle. Consequently, they are much more likely to develop illnesses such as heart disease, high blood pressure, and diabetes. In addition, the toxic greenhouse gases emitted by vehicles cause and exacerbate chronic, life-limiting conditions such as pulmonary disease, asthma, and diabetes.
CONCLUSION
The United States is a country that undoubtedly runs on wheels. Cars have fueled the economy since their inception and shaped American culture, cities, and habits, making them the go-to mode of transport for most people. However, change is on the horizon. The younger generation, due to greater environmental awareness and cost of living pressures, is no longer desperate to learn to drive, instead choosing to use public transportation or walk. With the adverse effect on health and the environment, future generations will hopefully continue to spend less time at the wheel and more time walking in the fresh air.
This report has been carefully compiled by LookupAPlate — a free license plate lookup service that allows users to report bad or reckless drivers. If you reference or share the statistics from this page, we kindly request that you credit us by including a hyperlink to this page or our homepage.
Sources:
- https://www.forbes.com/advisor/car-insurance/car-ownership-statistics/#department-of-transportation-federal
- https://www.postandcourier.com/automotive/millennials-choose-age-21-as-ideal-time-to-buy-or-lease-first-car/article_fc8bcb1a-a72d-11e8-9b0a-7f280856258c.html
- https://www.nytimes.com/2021/10/18/well/live/old-drivers.html
- https://www.hsph.harvard.edu/news/hsph-in-the-news/whats-behind-shocking-u-s-life-expectancy-decline-and-what-to-do-about-it/#:~:text=April%2013%2C%202023%20%E2%80%93%20U.S.%20life,December%20data%20from%20the%20CDC.
- https://aaafoundation.org/wp-content/uploads/2022/11/AAAFTS_Research-Brief_2022-American-Driving-Survey2020-2021.pdf
- https://datacenter.aecf.org/data/tables/99-total-population-by-child-and-adult-populations#detailed/1/any/false/2048/39,40,41/416,417
- https://www.kbb.com/car-advice/average-miles-driven-per-year/
- https://www.forbes.com/sites/jimgorzelany/2023/01/10/these-are-the-us-cities-where-motorists-lose-the-most-time-and-money-sitting-in-traffic/
- https://www.thezebra.com/resources/driving/average-length-of-car-ownership/
- https://www.fhwa.dot.gov/policyinformation/documents/2017_nhts_summary_travel_trends.pdf
- https://1800lionlaw.com/how-many-times-will-your-crash-you-car-in-your-lifetime/
- https://driver-start.com/blog/the_most_common_traffic_tickets/
- https://www.fhwa.dot.gov/policyinformation/statistics/2021/dl22.cfm
- https://www.jdpower.com/cars/shopping-guides/how-much-do-people-spend-on-gas-each-month#:~:text=What’s%20The%20Average%20Monthly%20Spend,2.24%25%20of%20their%20monthly%20income
- https://en.wikipedia.org/wiki/Driver%27s_licenses_in_the_United_States
- https://www.fhwa.dot.gov/policyinformation/statistics/
- https://medium.com/swlh/american-teens-are-driving-less-and-the-reasons-are-more-than-economic-4cf6217375a1
- https://www.dailymail.co.uk/health/article-11869111/Car-centric-lifestyle-reasons-American-life-expectancy-falling-peers.html

One Response
Awesome article!! This really helped me learn some data and facts about American society and how car-centered we really are. I was looking for resources to help write a college paper, and this came in handy. Thank you for trying to open people’s eyes about the reality of our society and what it can mean for us.