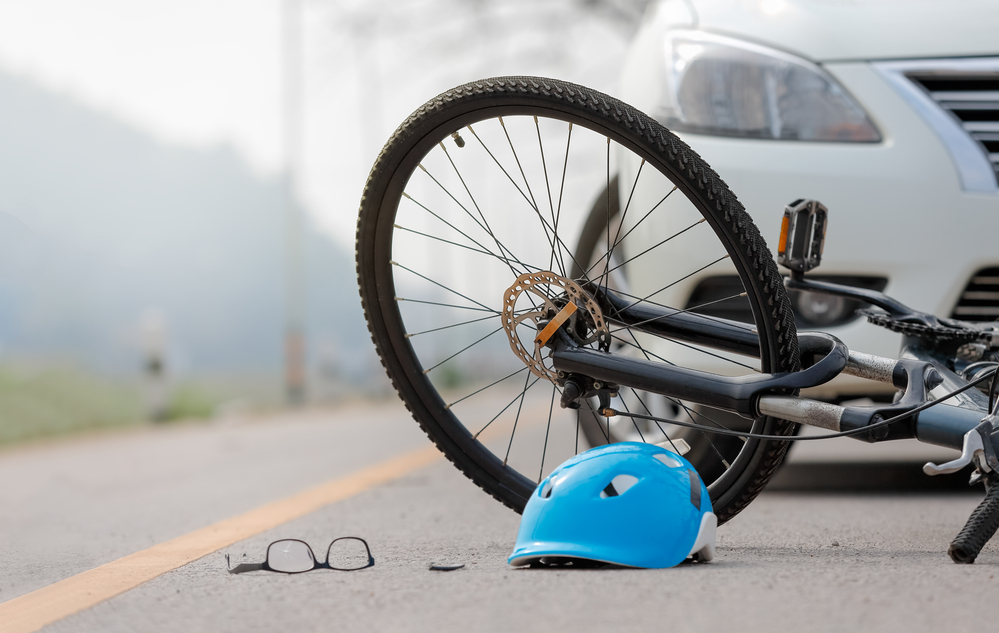
Whether you’re a road-weaving cyclist or a horn-honking car driver, you’ve likely got strong opinions about the other mode of transport. Cyclists often complain of dangerous drivers almost (or actually) knocking them off their bikes – we need more bike paths, they implore. Motorists, on the other hand, take a wholly different view, seeing cyclists as nothing more than a dangerous nuisance. “The roads aren’t built for bikes” is the general view.
Whatever side you fall on, they have one thing in common: accidents happen. Falling off your bike or getting into a fender-bender is a near-daily occurrence throughout the US. And while cyclists are completely exposed to injury, vehicle collisions carry so much force that accidents are often far worse.
But which is more dangerous? Should you give up your car for a little pedal power? Or is it safer to be encased in a couple of inches of metal, even if you’re going faster? That’s what we’re answering in this stat-focused article – and the answer might just surprise you.
Key Insights
- In 2020, cycling had a fatality rate of 0.269 per 100,000 people compared to a fatality rate of 11.7 for cars.
- Despite a 16-year high in car fatalities, the motor vehicle fatality rate per 100 million miles is actually at a historic low of 1.3.
- Bicycle trips comprise 1% of US trips but 2% of all people who die in a crash.
- Bicycling accidents are more common in the most populous states, like California, Texas, Florida, and New York; and rates rise in the warmer summer months, peaking in August. Car accidents are most common in Southern states, particularly South Carolina, Arkansas, and Mississippi.
- Car accidents are far more common than bicycling accidents. Approximately 130,000 cyclists are injured annually on US roads, relative to 2 million drivers injured.
- Men are responsible for the majority of cycling and car fatalities, 83.6% of bicycling deaths, and 71.8% of motor vehicle crash deaths.
Car vs. Bicycle Accidents: Numbers That Matter The Most
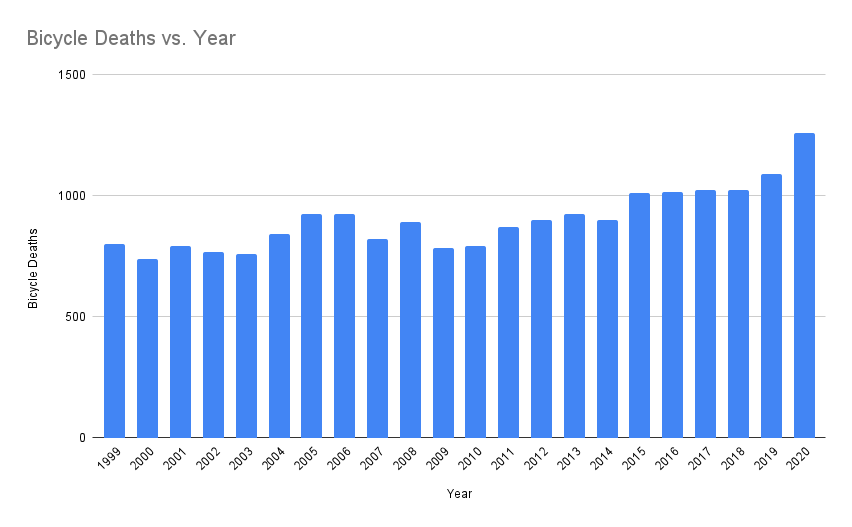
- In 2010, 623 cyclists died nationwide in comparison to 871 in 2018 and 1,260 in 2022, according to the National Highway Traffic Safety Administration (NHTSA).
- Nearly two-thirds of cycling accidents occur on major roads, although most bike accidents don’t involve other vehicles.
- In 37% of fatal cycling accidents, either the cyclist or motor vehicle driver has consumed alcohol recently.
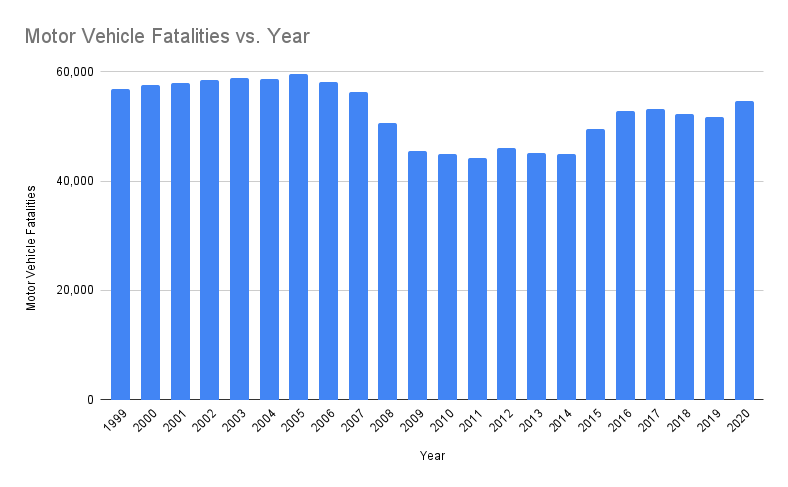
- In 2021, traffic fatalities hit a 16-year high, accounting for 42,915 deaths that year.
- Similar to cycling accidents, the majority of traffic fatalities (56%) occur on either an urban arterial or rural arterial road. Interstates are by far the safest roads nationwide.
- According to 2019 estimates, 80% of individuals involved in bicycle accidents were male, which is higher than the percentage of males involved in motor accident injuries (72%).
A cursory glance at the numbers indicates that US roads have become more dangerous in the past decade. Both cycling fatalities and traffic fatalities have increased substantially. While bicycling accidents appear paltry in comparison to the tens of thousands of traffic fatalities, in reality, per hour spent on the vehicle, they’re likely to be substantially closer. Indeed, bicycle trips comprise 1% of US trips but 2% of all people who die in a crash.
Moreover, despite the 16-year high in traffic fatalities, the motor vehicle fatality rate per 100 million miles traveled is close to the lowest ever level (1.3). The opposite is true of cycling – fatalities topped 1,260 in 2020, although preventable nonfatal injuries fell 39% to 325,173. That means over 27,000 bicycle injuries occur monthly, 6,250 occur weekly, and 890 occur every day.
By age, the 50-59 year old bracket was the most likely to be involved in a bicycling fatality – just 5% were children younger than 14. In total, 101 cyclists aged 50-59 were killed in 2019 (92 were men). Following that age group were 60-64-year-olds (90 deaths) and 65-69-year-olds (80 deaths).
Motor accidents show almost the reverse trend, with the highest number of deaths in 2021 occurring in 25 to 44 years olds (16,040 deaths), followed by 45 to 64 years olds (12,950 deaths) and 15 to 24-year-olds (7,425 deaths). Older adults were by far the safest drivers and the least likely to be involved in an accident.
Overall, California reports the highest number of cycling fatalities in 2020 (118), followed by Florida (90), and then New York and Texas (44 each). In contrast, the South has the highest motor fatality rates, with South Carolina (2.0), Arkansas (1.9), and Mississippi (1.9) taking the top three spots; Massachusetts had the lowest traffic fatality rate in the nation (0.63).
Car vs. Bicycle Accidents: Location
Cyclists are understandably nervous given the rising trend of cycling fatalities – up a quarter since 2010. Indeed, the more populous the state, the greater the risk of an accident.
But does that translate to the metro level?
It turns out, yes. California, Texas, and Florida collectively contain 13 of the most dangerous cities for cyclists. An analysis by carinsurance.org found that Cape Coral, FL, Abilene, TX, and San Bernardino, CA were the most dangerous US cities for cyclists. Cape Coral, for example, had a shocking 1,333 annual bike fatalities per 100K commuters, meaning a little over 1 in every 100 cyclists died that year (although 0% of fatalities involved an individual wearing a helmet).
Want the safest city?
In 2021, that accolade went to Boulder, CO, according to an analysis by Your Local Security, which ranked cities using a 100-point scale. Interestingly, Californian cities like Mountain View, Davis, and Eugene also made the top 10.
Car accidents, on the other hand, are most likely to occur in Baltimore, MD, Washington, DC, and Boston, MA. Compared to the National Average, the relative collision likelihood in Baltimore was 152.5%, with an average of 4.19 years between collisions (the national average is 10.57 years).
Cary, North Carolina, is the safest city to drive around in the US. It averages 12 years between collisions and sees just 1.8 motor vehicle fatalities per 100,000.
Car vs. Bicycle Accidents: Main Causes
Biking accidents can occur due to a myriad of reasons. After all, speeding along on two wheels is a somewhat precarious situation.
According to the NHTSA, the top causes of bike accidents are:
- Being hit by a car (30%)
- Fall off the bike (17%)
- Roadways in disrepair (13%)
- Rider error (13%)
- Crashing or colliding with a fixed object (7%)
- Dog running into the cyclist’s path (4%)
It’s not hard to guess the leading causes of car accidents. Analyzing data from 2006 to 2015 found that 30.6% of car accidents were due to speeding – the faster the car went, the more likely a motor vehicle death was to occur. Almost half of all motor vehicle deaths occur over 55 mph.
The next four causes of car accidents included: drunk driving (31%), distractions, e.g., texting, talking on the phone, eating (16%), weather (22%), and running a red light.
Car vs. Bicycle Accidents: Injury Rate
CDC statistics indicate that over 130,000 cyclists are injured annually on US roads. While, as noted earlier, older adults suffer much higher death rates, injuries peak among adolescents, teens, and young adults. In fact, people aged 10 to 24 years old account for almost a third of all bicycle-related injuries, with males 5 times more likely to get injured than females.
Bicycle helmets, despite their “uncool” reputation, almost certainly reduce the risk of head and brain injuries across all age groups. Other injury-reducing measures include wearing fluorescent clothing or retro-reflecting clothing and fitting active lighting to a bike.
In car accidents, significant emphasis is placed on fatalities. However, in 2020, the number of people injured declined by 17% from the previous year. In 2015, almost 250,000 injuries occurred due to a motor vehicle collision (10% of people injured that year).
Car vs. Bicycle Accidents: Fatality Rate
Cycling fatality rates are rising worryingly fast. While just 623 people died in 2010, by 2021, the number had risen to 1,260 – a 49% increase. Bicycle-related deaths peak during the warmer months, with a jump in May that continues until September. August sees the highest number of fatalities (157), and February sees the fewest (53).
As noted, absolute traffic fatalities have spiked over the past decade, from 32,479 deaths in 2011 to 42,915 deaths in 2021. However, the relative fatality rate has continuously declined over the past 100 years. In 1921, 24.1 traffic fatalities occurred per 100 million miles, compared to just 1.3 in 2021. So, while the initial picture appears to be worsening, the spike in traffic fatalities is likely due to an increase in miles rather than an increase in overall danger.
Is Cycling More Dangerous Than Driving?
Broadly speaking, yes. However, it depends on several factors. For example, a younger bicyclist riding on rural roads is probably safer compared to the same individual driving. While fatal accidents due to cycling are vanishingly rare, that’s only due to fewer bicycling trips than cars. Mile for mile, cycling is more dangerous than driving.
References:
- https://www.cdc.gov/transportationsafety/bicycle/index.html
- https://injuryfacts.nsc.org/home-and-community/safety-topics/bicycle-deaths/
- https://injuryfacts.nsc.org/motor-vehicle/overview/age-group-comparisons/
- https://www.nhtsa.gov/press-releases/early-estimate-2021-traffic-fatalities
- https://usafacts.org/articles/how-many-people-die-in-traffic-accidents-in-the-us/
- https://247wallst.com/transportation/2022/02/02/americas-safest-city-for-driving/
- https://www.bicycling.com/news/a22144265/safest-and-most-dangerous-cycling-cities/
- https://www.yourlocalsecurity.com/blog/safest-cities-america-cyclists/
- https://www.cyclingweekly.com/news/these-are-the-safest-and-most-dangerous-us-states-for-cyclists
- https://www.carinsurance.org/deadliest-cities-for-cyclists/
- https://dailyinfographic.com/which-us-cities-have-the-highest-rate-of-car-accidents
- https://www.after-car-accidents.com/car-accident-causes.html
- https://www.cdc.gov/transportationsafety/bicycle/index.html
- https://www.raphaelsonlaw.com/legal-insights/common-car-accident-injuries
- https://www.transportation.gov/briefing-room/nhtsa-releases-2020-traffic-crash-data
